
Discussion about transport investment often focuses on spending over a handful of years, whether that be on a specific scheme or within a certain area. To some extent, these short-term comparisons are probably unavoidable. But it’s a poor way of assessing the overall state of transport when the networks on which people rely have been built up over decades – almost 200 years in the case of the railways. Today’s investments should ideally be looked at in the context of the overall system: how well connected is the UK, whether those links were built last year or last century.
The National Infrastructure Commission has today published a new set of measures for transport connectivity – how good the transport system is at getting people from A to B. For the first time, this dataset provides measures of connectivity, both by car and by public transport, within and between 1,000 places across Great Britain. It means we can now see on a national scale the relative ease with which people can get around, whether on their daily commute or further afield.
Of course, connectivity is not the only thing that matters. This data sits within a wider set of performance measures published by the Commission, covering aspects such as resilience and the environment. But the ability to compare connectivity across 1,000 different places in the country is a good place to start. Anyone in these locations will now be able to use this data to see how their connectivity compares to places of a similar size and character, and identify their relative strengths and weaknesses.
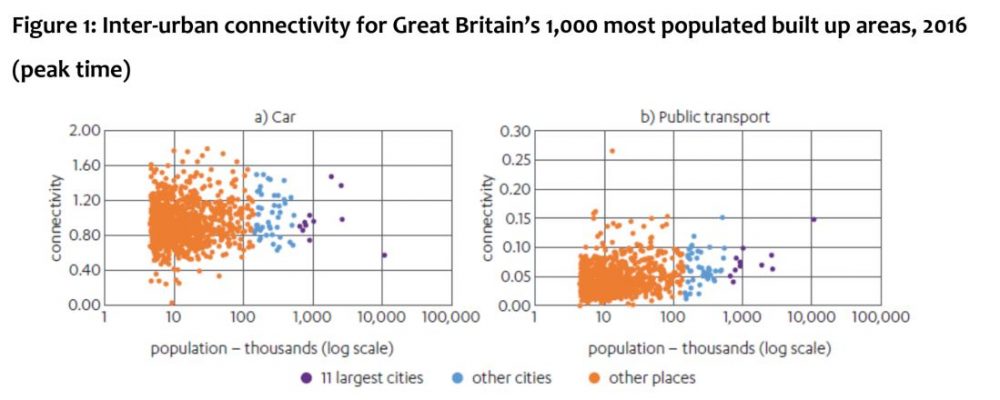
As you might expect, there is a fair amount of variation in connectivity between places. But there are no clear regional patterns. Nor do larger cities seem particularly better or worse connected by the road network to other places compared to smaller towns. Although cities connect to fast, straight roads these also have more traffic, at least at peak times, and the two effects seem to balance out. Public transport links are somewhat better from bigger cities. London is an outlier, with some of the best public transport connectivity to the rest of the country, but some of the worst road connectivity.
There is a much clearer pattern for connectivity within places – that is, the ease of travel to the centre from elsewhere within a town or city, whether by car or public transport. Again, the findings do not suggest large regional differences. But the key challenges for urban connectivity are clearly in the larger cities.
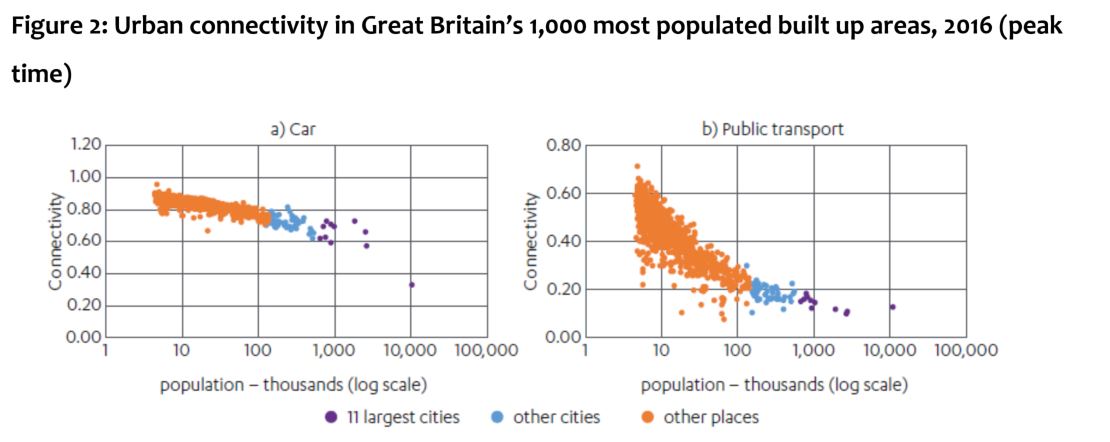
All of the 50 largest cities, except Milton Keynes, are ranked in the bottom 20 per cent of places for car connectivity on this measure. Transport networks in the largest cities are less able to cope with the level of traffic at peak times, affecting travel speeds into city centres and reducing connectivity. This could also explain why public transport shows the same pattern: bus journey times are directly impacted by the congested roads.
The maps below show within-city connectivity in 2016 by car and public transport, with the larger circles corresponding to larger populations.
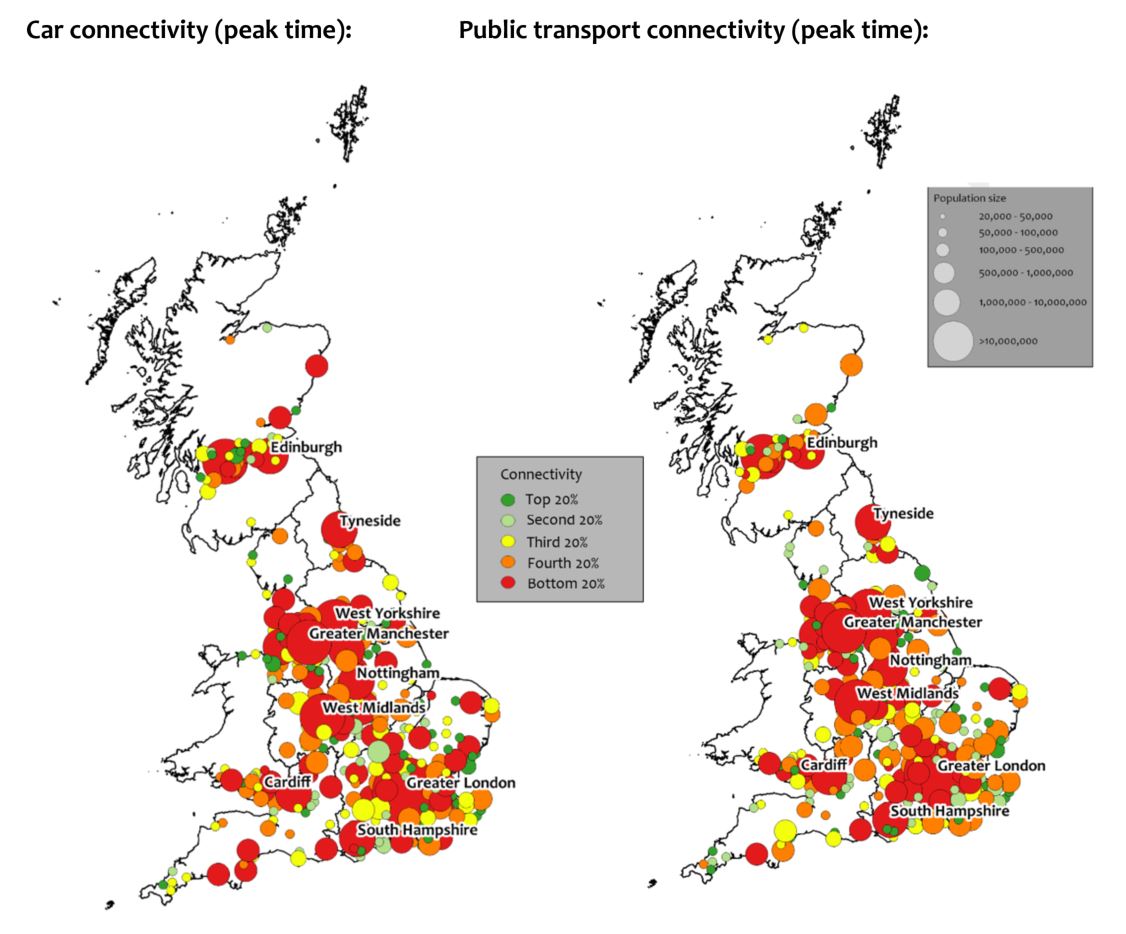
Transport networks within big cities have not been keeping pace with the greater demand placed on them. This is true even in London, despite the dense public transport network which is in place.
In recent years, government has prioritized major upgrades to transport between cities. The Commission set out in the National Infrastructure Assessment that the next wave of major upgrades should increase the focus on transport within cities. The government have committed to responding to the Assessment in a National Infrastructure Strategy in 2019. The Strategy needs to give cities devolved, long term funding to tackle these challenges.
Since making this recommendation, the Commission has gone further, launching a partnership programme for cities and city regions across the country to help local leaders develop long-term strategies that link transport, housing and job opportunities.
The discussion paper published today provides further information on the connectivity measures and initial analysis. But this is just a start, and no doubt there are lots of interesting results to find in this data. We welcome the further use of the data and would be interested in engaging with any analysis undertaken using these new metrics.
Dr James Richardson is Chief Economist, and Harriet Egdell-Page is an Economic Adviser, at the National Infrastructure Commission