Looking back at transport development

Apprentice Economist Maisie Darby introduces new data on historic transport development in Britain.

Published: 12 Mar 2021

By: Maisie Darby

Tagged: ,

A Princess Coronation (Duchess) class express steam locomotive steaming fast up the west coast main line on the fringes of the English Lake District. A car travelling in the opposite direction is on the adjacent M6 motorway.

If you’re reading this, you’ll probably know we recently launched our data pages, an area of our website which provides you with easy access to the data we have used, and data we think you’ll find interesting.

As promised in our launch blog, we have now added our historic transport datasets which you can find here. Some of the data has been brought to life by our visualisations, making the data easier to relate to, and viewable instantly.

Ever wondered about the total length of roads in Britain? One of our sets of visualisations reveals the answer, and consists of data from 1922 to 2019 (the most recent data courtesy of the Department for Transport). There were 70,000 miles of road added over the last one hundred years – an increase of 40% – which is the equivalent distance to travelling almost three times round the Earth. However, the rate of increase has slowed in recent years.

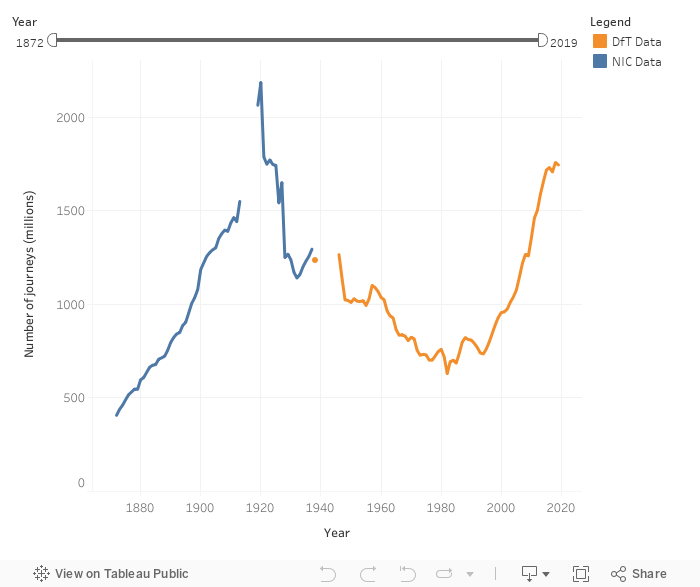
We’ve also highlighted how the number of passengers using the railway has changed. As you can see below, this shows how rail use has varied considerably over time.

Perhaps you are interested in how the type of vehicle use has changed over time. Our second set of visualisations show the number of private cars, goods vehicles, motorcycles, and tramcars in use from 1904 to 1964.

Interested in the history of British civil aviation? The civil aviation visualisations consist of three datasets from the early twentieth century: the total aircraft miles flown, the number of passengers carried, and the weight of cargo carried, between 1919 and 1938. The miles travelled by British airlines increased ten-fold between 1930 and 1938, while the amount of cargo carried increased almost 7-fold.

This is the first time that this historic transport data has been published online in one place and made widely available; it provides an interesting insight into the evolution of the transport sector in Britain and provides a context within which to view current data. Let us know if you’ve found it interesting, or plan on using it in your work or studies.

We will continue to add more data and more interactive visualisations to these pages, so make sure to bookmark the data pages and regularly check for updates!

Maisie Darby is an apprentice economist at the National Infrastructure Commission.

Share this article

<

Recent Articles

Coming up in 2024
Thumbtack pins in calendar concept for busy, appointment and meeting reminder

Coming up in 2024

This page shows a calendar reflecting the latest expected dates for Commission reports, publications and events. You can also sign up to receive our quarterly newsletter by entering your email address in the box at the foot of each website page.

1 Feb 2024 By
We’re recruiting – analysts
Footbridge across the Aire River in West Yorkshire, England

We’re recruiting – analysts

The Commission is recruiting two analyst advisers (at SEO level) to join its analysis and modelling team, which develops the data and economic models that support the Commission in delivering its advice to government on meeting the UK’s long term infrastructure needs. The roles will be based in our Leeds office. Successful candidates will lead...

3 Apr 2024 By
Winser: NAO call for robust plan to boost low carbon heating “absolutely right”
picture of a heat pump by a wall

Winser: NAO call for robust plan to boost low carbon heating “absolutely right”

A National Audit Office report out today (18 March 2024) says heat pump installations are falling well below the level needed to meet the government’s targets of 600,000 units installed each year by 2028. The NAO says in response that a more robust plan from government and greater clarity on the future role if any...

18 Mar 2024 By
Government response on surface water flooding risk “does not meet scale of challenge”
A car splashes through a flooded Farringdon Lane in central London after a day of heavy rain.

Government response on surface water flooding risk “does not meet scale of challenge”

The government has today (13 March 2024) responded to the Commission’s study on reducing the risks of surface water flooding, published in November 2022. While it accepts the principles behind a number of the Commission’s recommendations, the government’s response – in the Commission’s view – makes few new commitments on steps to manage surface water...

13 Mar 2024 By

Evidence_Icon_Turquoise Created with Sketch.

Explore data used in the Commission's research, and gain insights from across UK infrastructure

Join our team of professionals supporting the Commission to provide evidence based and forward thinking advice on infrastructure strategy.