Baseline Report Annex E: Waste
Analysis of the UK's waste infrastructure which informs the Baseline Report for the second National Infrastructure Assessment.
Tagged: Energy & Net Zero
Sector overview
The primary role of the solid waste sector is to manage waste to protect public health and the natural environment. This includes household, industrial and commercial waste, construction and demolition waste, and hazardous waste.
Solid waste infrastructure supports the key functions of collecting, sorting and treating or disposing of waste. It consists of assets such as incinerators, anaerobic digestion plants, recycling plants, waste sorting facilities and waste trucks to transport the waste.
Waste and the Commission’s remit
The Commission’s remit covers the solid waste sector. This includes household waste, commercial and industrial waste, and construction and demolition waste. Wastewater is considered alongside the water sector (see Annex D: Water and wastewater).
Policy responsibility for waste is a devolved to the governments of Scotland, Wales and Northern Ireland. The Commission’s remit covers England only.
Box E.1: Governance and regulation across the UK
Whilst there are differences in the specifics of policy measures, national priorities and strategies, the nations of the UK all share the aim to drive action further up the waste hierarchy and work towards a more circular economy. The waste hierarchy ranks waste management options based on environmental impact.1 In 2020, the four administrations of the UK published a joint statement under the Circular Economy Package which outlined how they will work together towards a circular economy and committed the UK to maintain or exceed environmental standards previously set in Europe.2
The regulators for waste in the devolved administrations are:
- Natural Resources Wales
- the Scottish Environmental Protection Agency
- the Department for Agriculture, Environment and Rural Affairs in Northern Ireland.
They are responsible for issuing authorisations in the same way as the Environment Agency in England – see below.
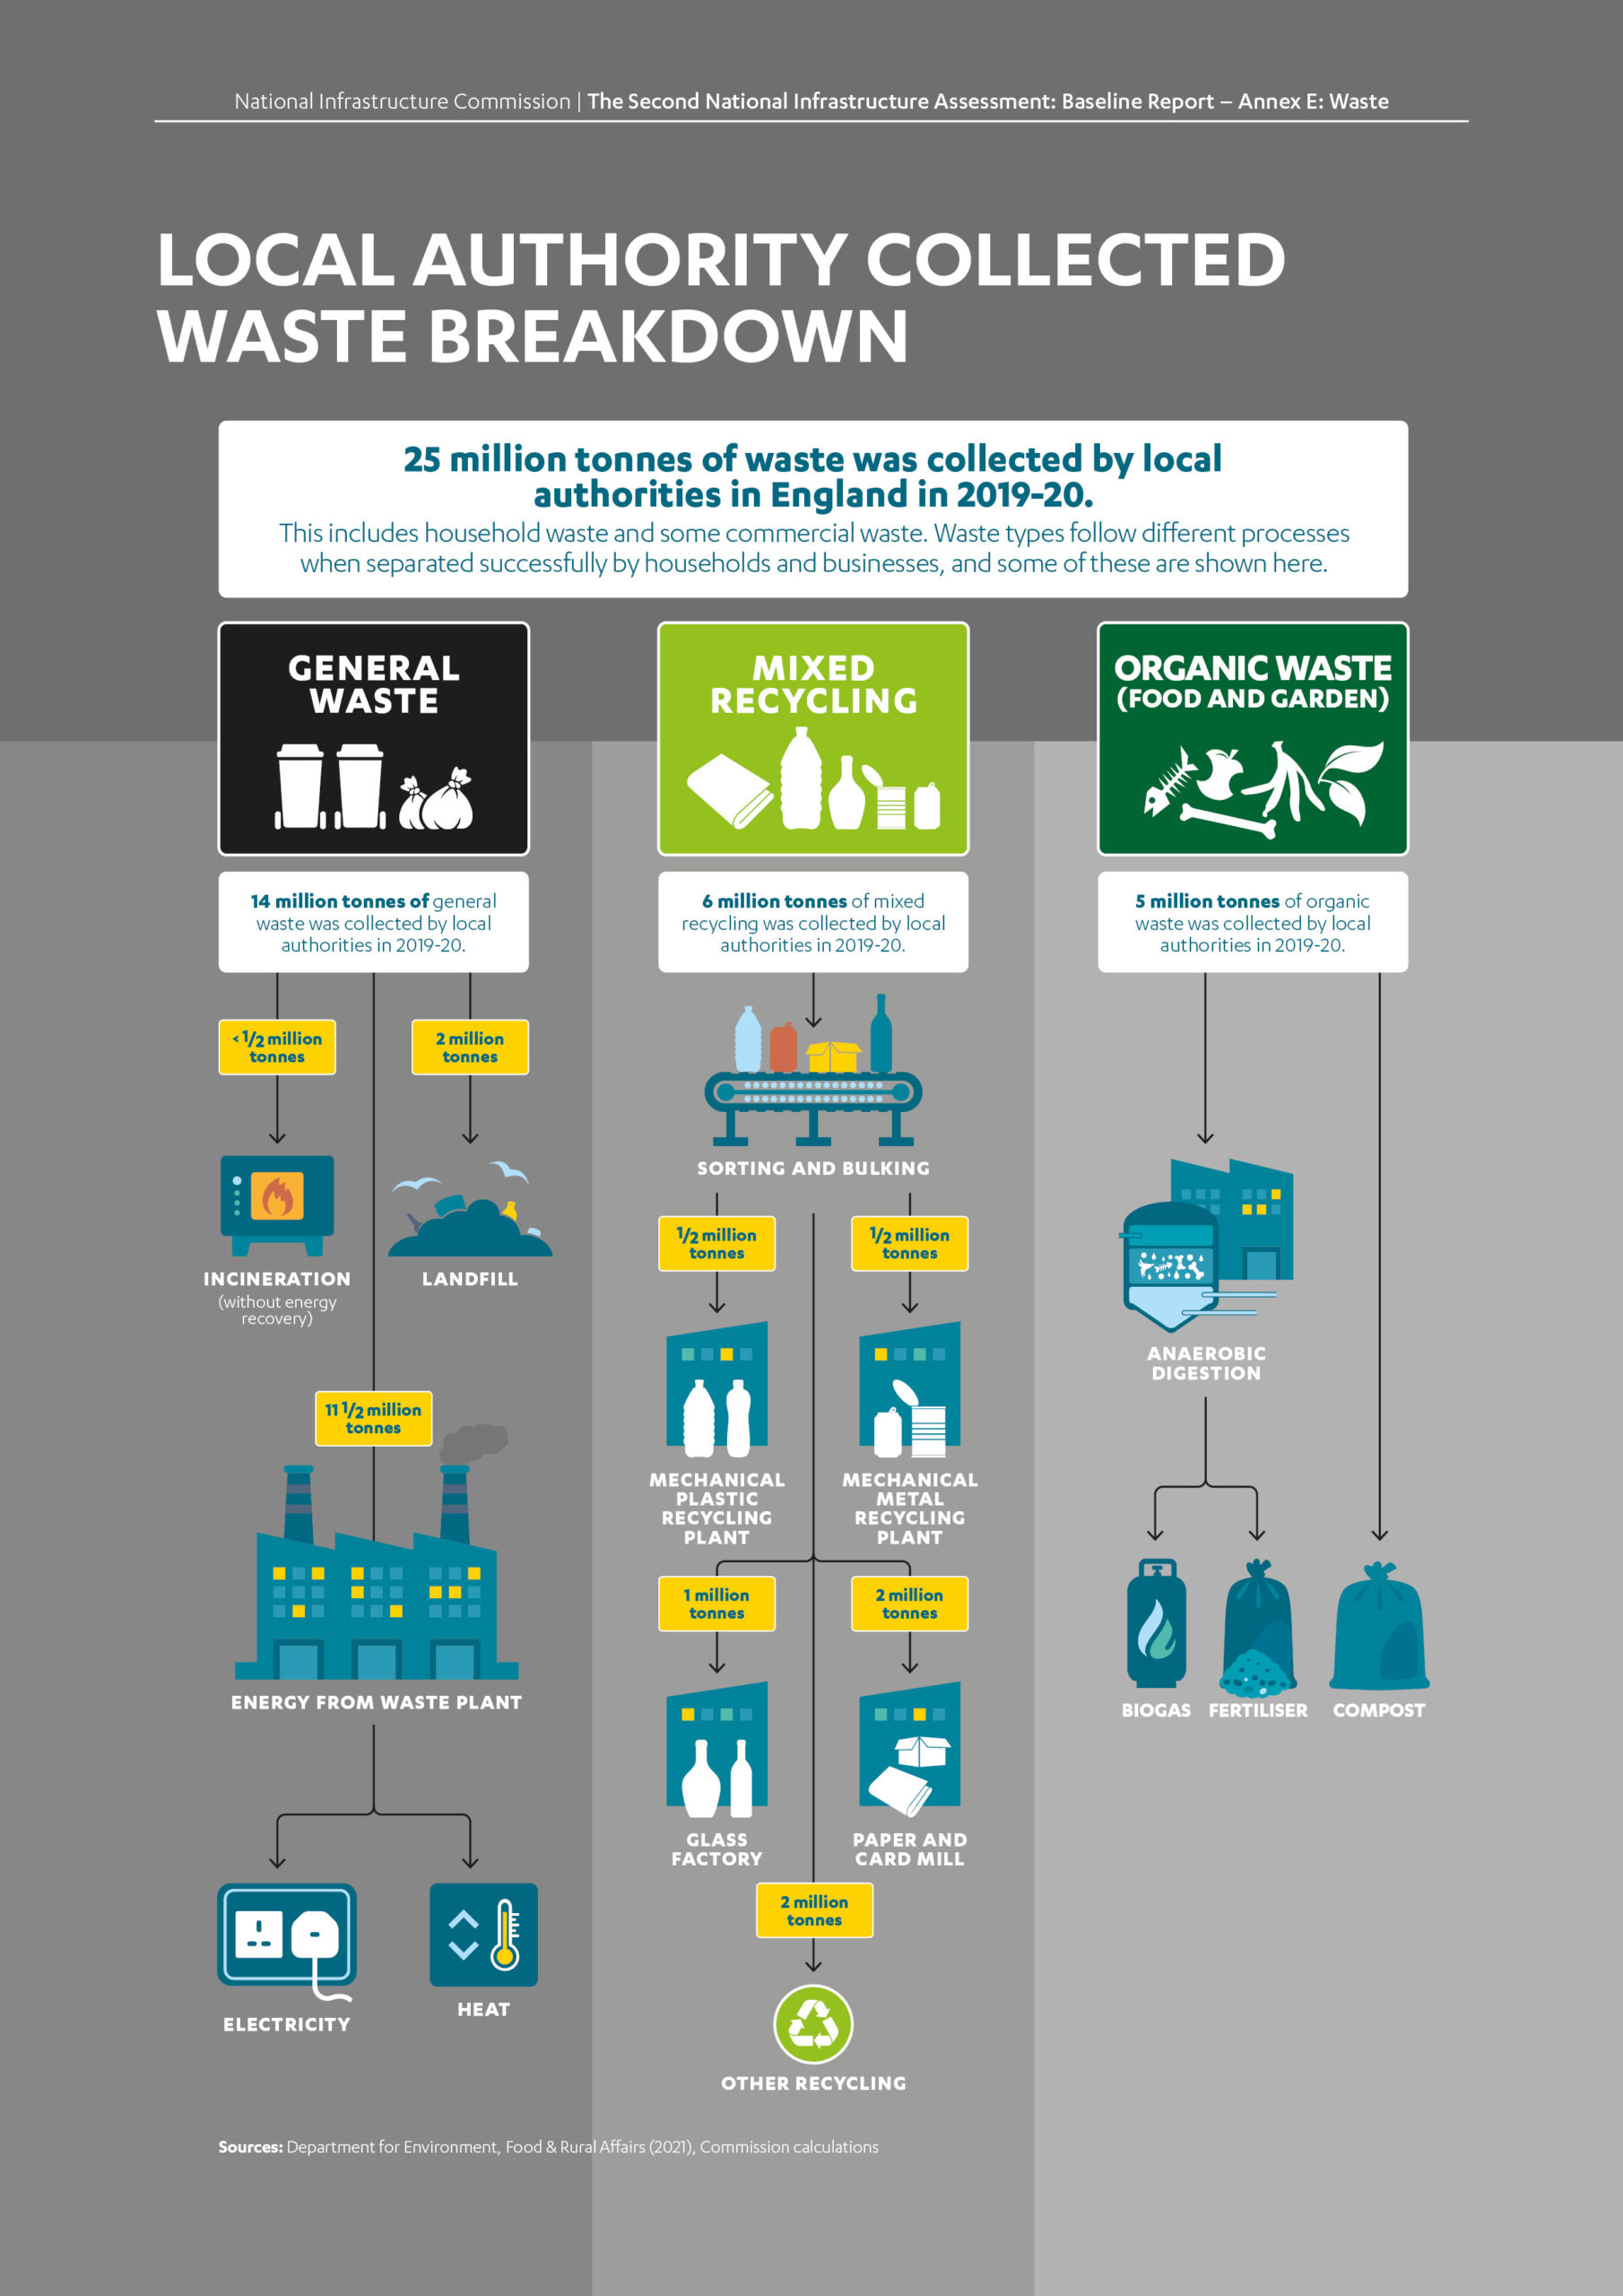
England generated 187 million tonnes of waste in 2018, including 120 million tonnes of construction waste,3 22 million tonnes of household waste,4 with the remainder from other commercial and industrial sectors.5 Local authorities manage household waste, and some other waste streams such as collections from street bins and some commercial waste collected by local authorities. In 2018-19, local authorities in England collected 26 million tonnes of waste.6
The total volume of waste produced in England has increased over the last decade (figure E.1). In 2010, the aggregate volume was around 170 million tonnes, which when compared to 2018 totals, shows a 12 per cent increase.7
Disposal methods vary for different waste types and material streams. While the construction sector generates the most waste, much of this is recovered.8 Part of this recovery will be through a construction process, known as backfilling, which reuses or replaces the soil that is removed during the excavation of foundations, along with ground bearing slabs and other groundworks used to support and strengthen a structure. While there are specific challenges associated with construction waste, this annex focuses on the performance of the local authority waste sector, where more consistent data are available. However, commercial waste and construction waste from other infrastructure sectors will be considered as part of the Commission’s work in the second Assessment (see Chapter 3: Climate Resilience and the Environment).
Local authority collected waste is disposed of via landfill and incineration, or processed through energy from waste, recycling and mechanical biological treatment (including composting and anaerobic digestion). General black bag waste is either incinerated (with or without energy recovery) or sent to landfill. Mixed recycling is sent to Materials Recovery Facilities (MRFs), to be sorted. Dry recycling such as plastic, glass, metal and paper is then sent to further recycling plants to be processed for future use. Food, when separated from other general waste, can go directly to compost or anaerobic digestion plants. Figure E.2 shows the mix of treatment methods for local authority collected waste.
Figure E.1: Total waste generation in England has risen marginally year on year
Total tonnage of all waste arisings in England from 2010-2018
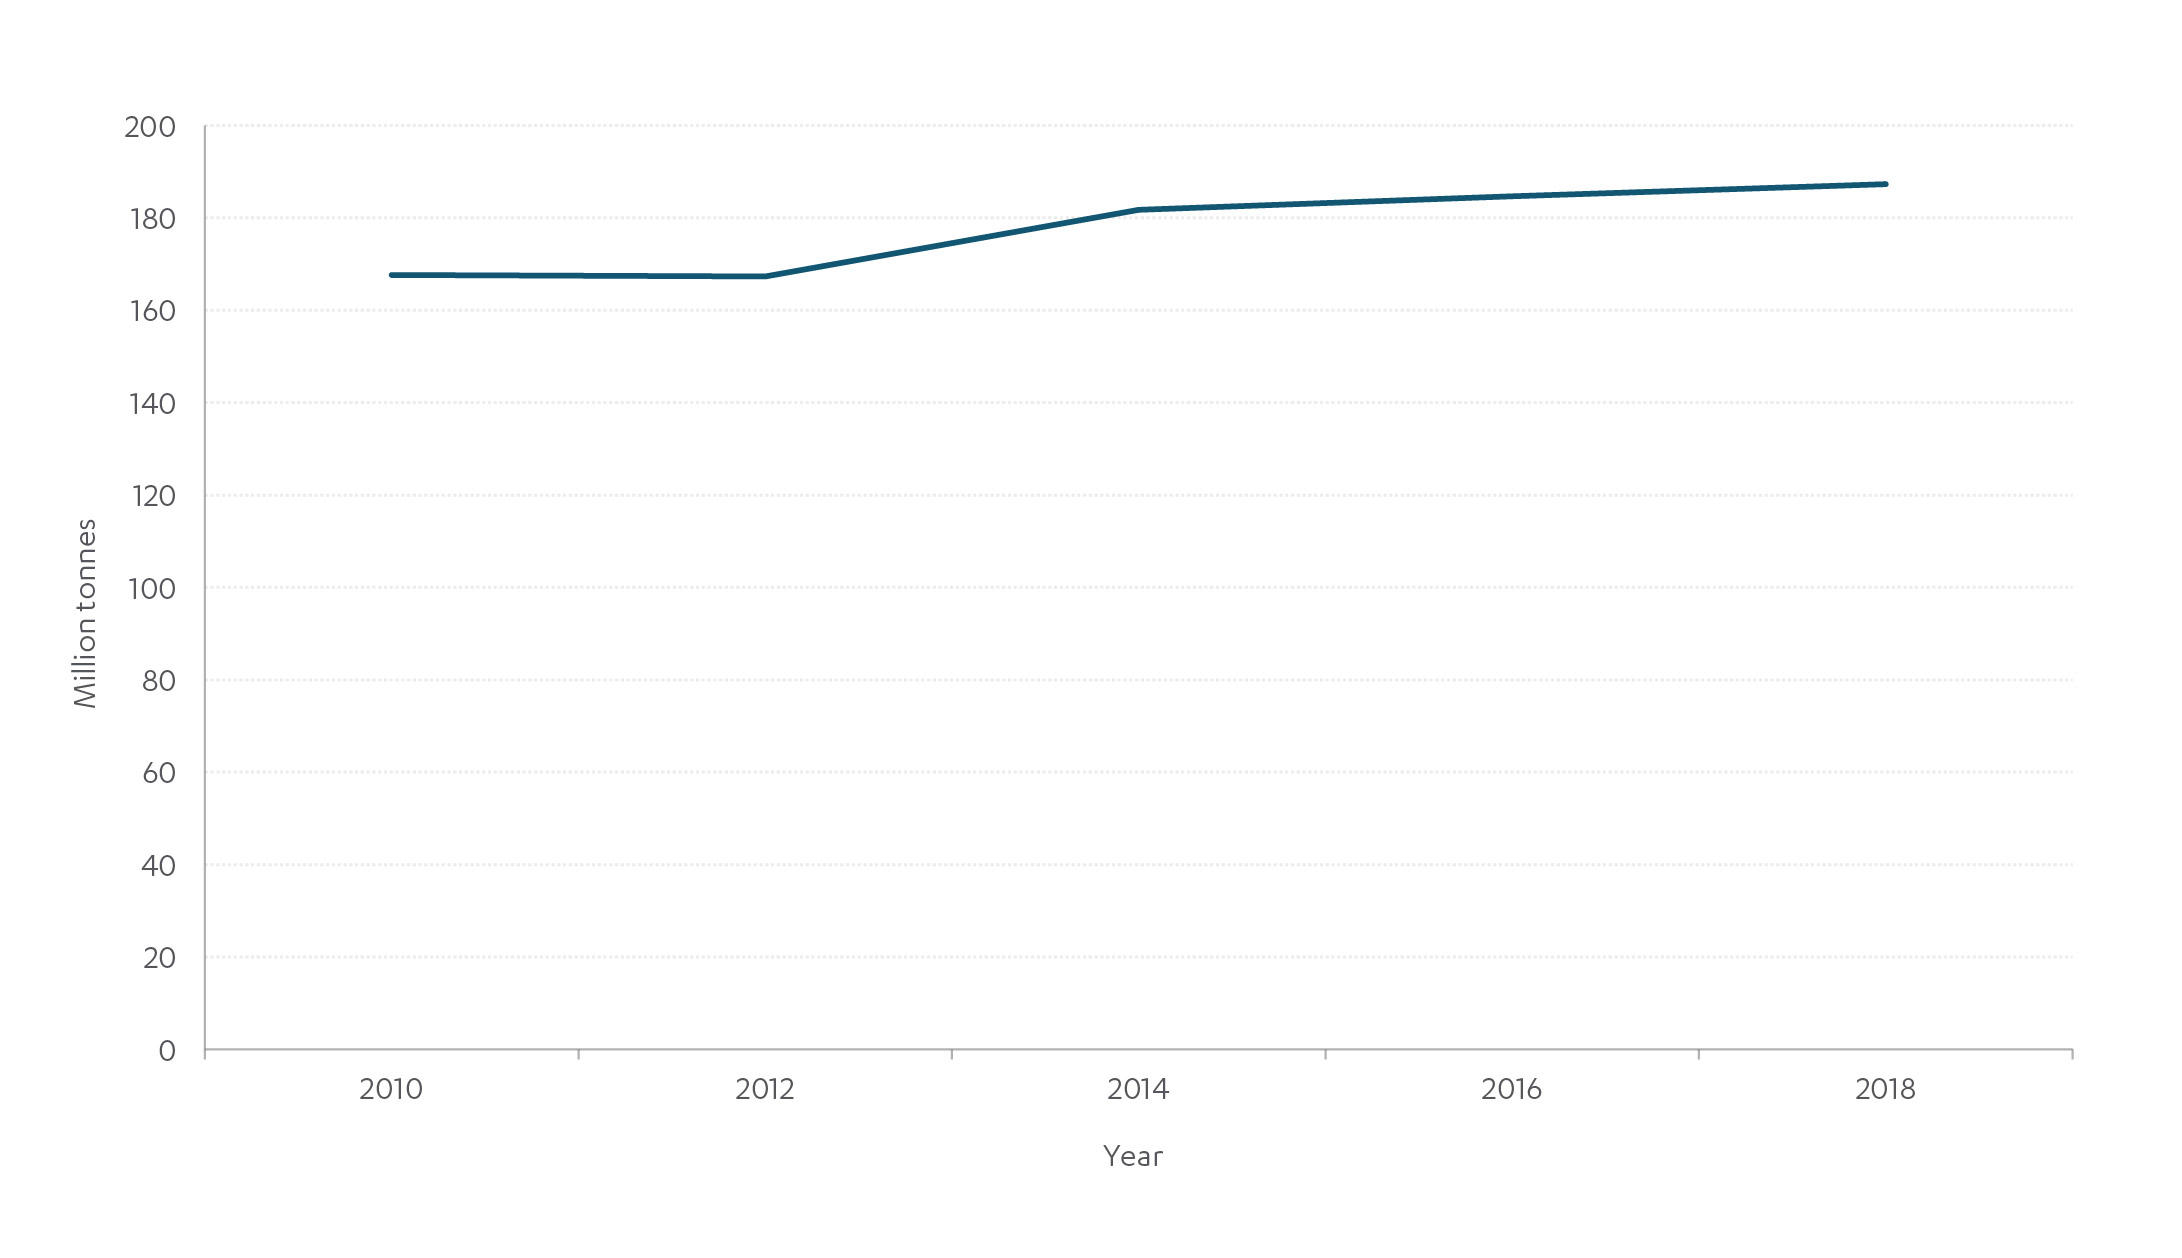
Source: Defra (2021), UK statistics on waste
Figure E.2 Local authority collected waste is increasingly going to recycling and energy from waste rather than landfill
Treatment of local authority collected waste, England, million tonnes, 2000-2020

Source: Defra (2021), ENV18- Local authority collected waste: annual results tables9
Next Section: Industry, governance and regulation
The government sets the national waste management and environmental policy framework for England, in line with the waste hierarchy and wider sustainability goals.
Industry, governance and regulation
The government sets the national waste management and environmental policy framework for England, in line with the waste hierarchy and wider sustainability goals.
The Environmental Protection Act 1990 specifies that local authorities have a duty to collect and dispose of household waste.10 This duty is performed by Waste Collection Authorities and the Waste Disposal Authorities. Unitary authorities perform both functions and in two-tier areas, district councils are the collection authority and county councils are the disposal authority.
There is also a legal duty of care on anyone who imports, produces, carries, keeps, treats or disposes of controlled waste. This differs depending on who produces the waste. For example, households have a duty to take all reasonable measures to ensure that any household waste produced is transferred to an authorised person, which in most cases will be the local authority. Other waste producers, such as businesses and other organisations, have a duty to keep their waste safe and to ensure that people who take their waste away are authorised to do so, and are able and likely to deal with it, or dispose of it, lawfully and safely.11
The Environment Agency is the primary regulator for waste matters in England. It is responsible for issuing and regulating authorisations for operations in the waste sector (which include registrations and environmental permits), and for tackling waste crime. Environmental permits are necessary for using, transporting, treating, storing and disposing of waste.12
The UK market is concentrated and dominated by the ‘Big Five’ – Biffa, FCC, Suez, Veolia and Viridor. They generated over £5 billion revenue in the UK in 2020.13
Box E.2: The history of waste management in England
England had informal waste sites for hundreds of years, with cities and towns managing waste on an individual basis. In the late 18th century, London’s first solid waste management systems began to evolve through ‘dust yards’. These yards predominantly collected coal waste, a key resource for brick manufacturing and an effective fertilizer.14 Poor health linked to industrialisation and urbanisation led to the 1875 Public Health Act. This gave local authorities a legal responsibility to provide residents with regular rubbish removal services.15 Around this time, incineration became the key form of waste disposal.16 The first incinerator was opened in Nottingham in 1874.
Over the last 100 years, changes in the use of waste infrastructure have been driven by changes in the volume and composition of waste. As society moved from coal to gas and electricity in the early 20th century, coal related waste fell steadily, while other forms of waste increased. Similarly, there was a significant increase in consumption, leading to a higher volume of waste.17
Over time, landfill became the prime disposal method across England. The UK’s economic growth led to even faster increases in aste generation and pollution, outstripping England’s capacity to effectively manage waste without environmental damage.18
To address this, the government passed the Environmental Protection Act 1990 and introduced a landfill tax in 1996.19 These measures discouraged the use of landfill and began the shift to waste management methods seen today.20
Funding and financing
Funding
Household waste management, collection and onward treatment is funded through central and local taxation.
Revenue outturn returns by local authorities include the total costs of running local authority waste services. Across waste services, disposal is the most significant cost to the sector, followed by collection. Recycling costs are significantly lower. In 2019-20, local and central government spent a total of just over £5 billion in operational (resource) expenditure.21 Local authorities will deal with a small portion of commercial and industrial waste, for which they charge. Known as trade waste, it generated a small surplus of £41 million in 2019-20, which therefore reduces the costs to resource spending.22 This surplus is included in the totals.
Figure E.3: The total cost of running the waste management sector highlights small fluctuations over the past decade
Waste management resource spending by local and central government, 2008-09 to 2019-20
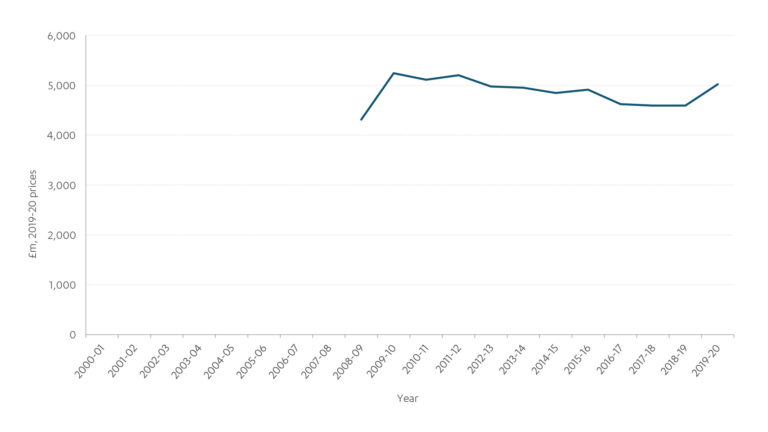
Source: HMT (2021); Public Expenditure Statistical Analyses
Commercial and industrial businesses pay for waste management services directly. Certain businesses that handle or place packaging on the UK market are subject to obligations to increase the recycling of packaging waste. They do this by acquiring evidence of packaging waste recycling, in proportion to the amount and type of packaging they place on the market, their role in the supply chain and the recycling targets for the different packaging materials. This is referred to as the Packaging Recovery Notes Scheme.23
Private waste companies and local authorities (depending on who owns the assets) will also raise funds through selling the energy or other outputs produced by energy from waste, anaerobic digestion plants and recycling plants. However, data is not collected systematically across private funding sources. The large waste companies in the sector operate internationally, publishing financial statements covering multiple countries. Furthermore, exemptions that apply to smaller companies limit the level of financial details published.
Financing
The upfront investment in waste infrastructure is either financed directly by local authorities, financed directly by the private sector, or by local authorities through private finance initiative (PFI) contracts with the private sector. In the latter, the private sector finances the upfront costs of the construction and development of new waste treatment plants, with local authorities repaying the investment over the contract lifespan.24
Total public capital spending on waste management has marginally increased since 2010. There was also a significant spike between 2017 and 2018 (as shown in figure E.4) caused by Greater Manchester Waste Disposal Authority buying out its PFI contract.25
Figure E.4: Capital spending on waste has marginally increased, aside from the private finance initiative buy out in 2017-18
Local and central government investment across waste collection and disposal in England, from 2010-11 to 2019-20
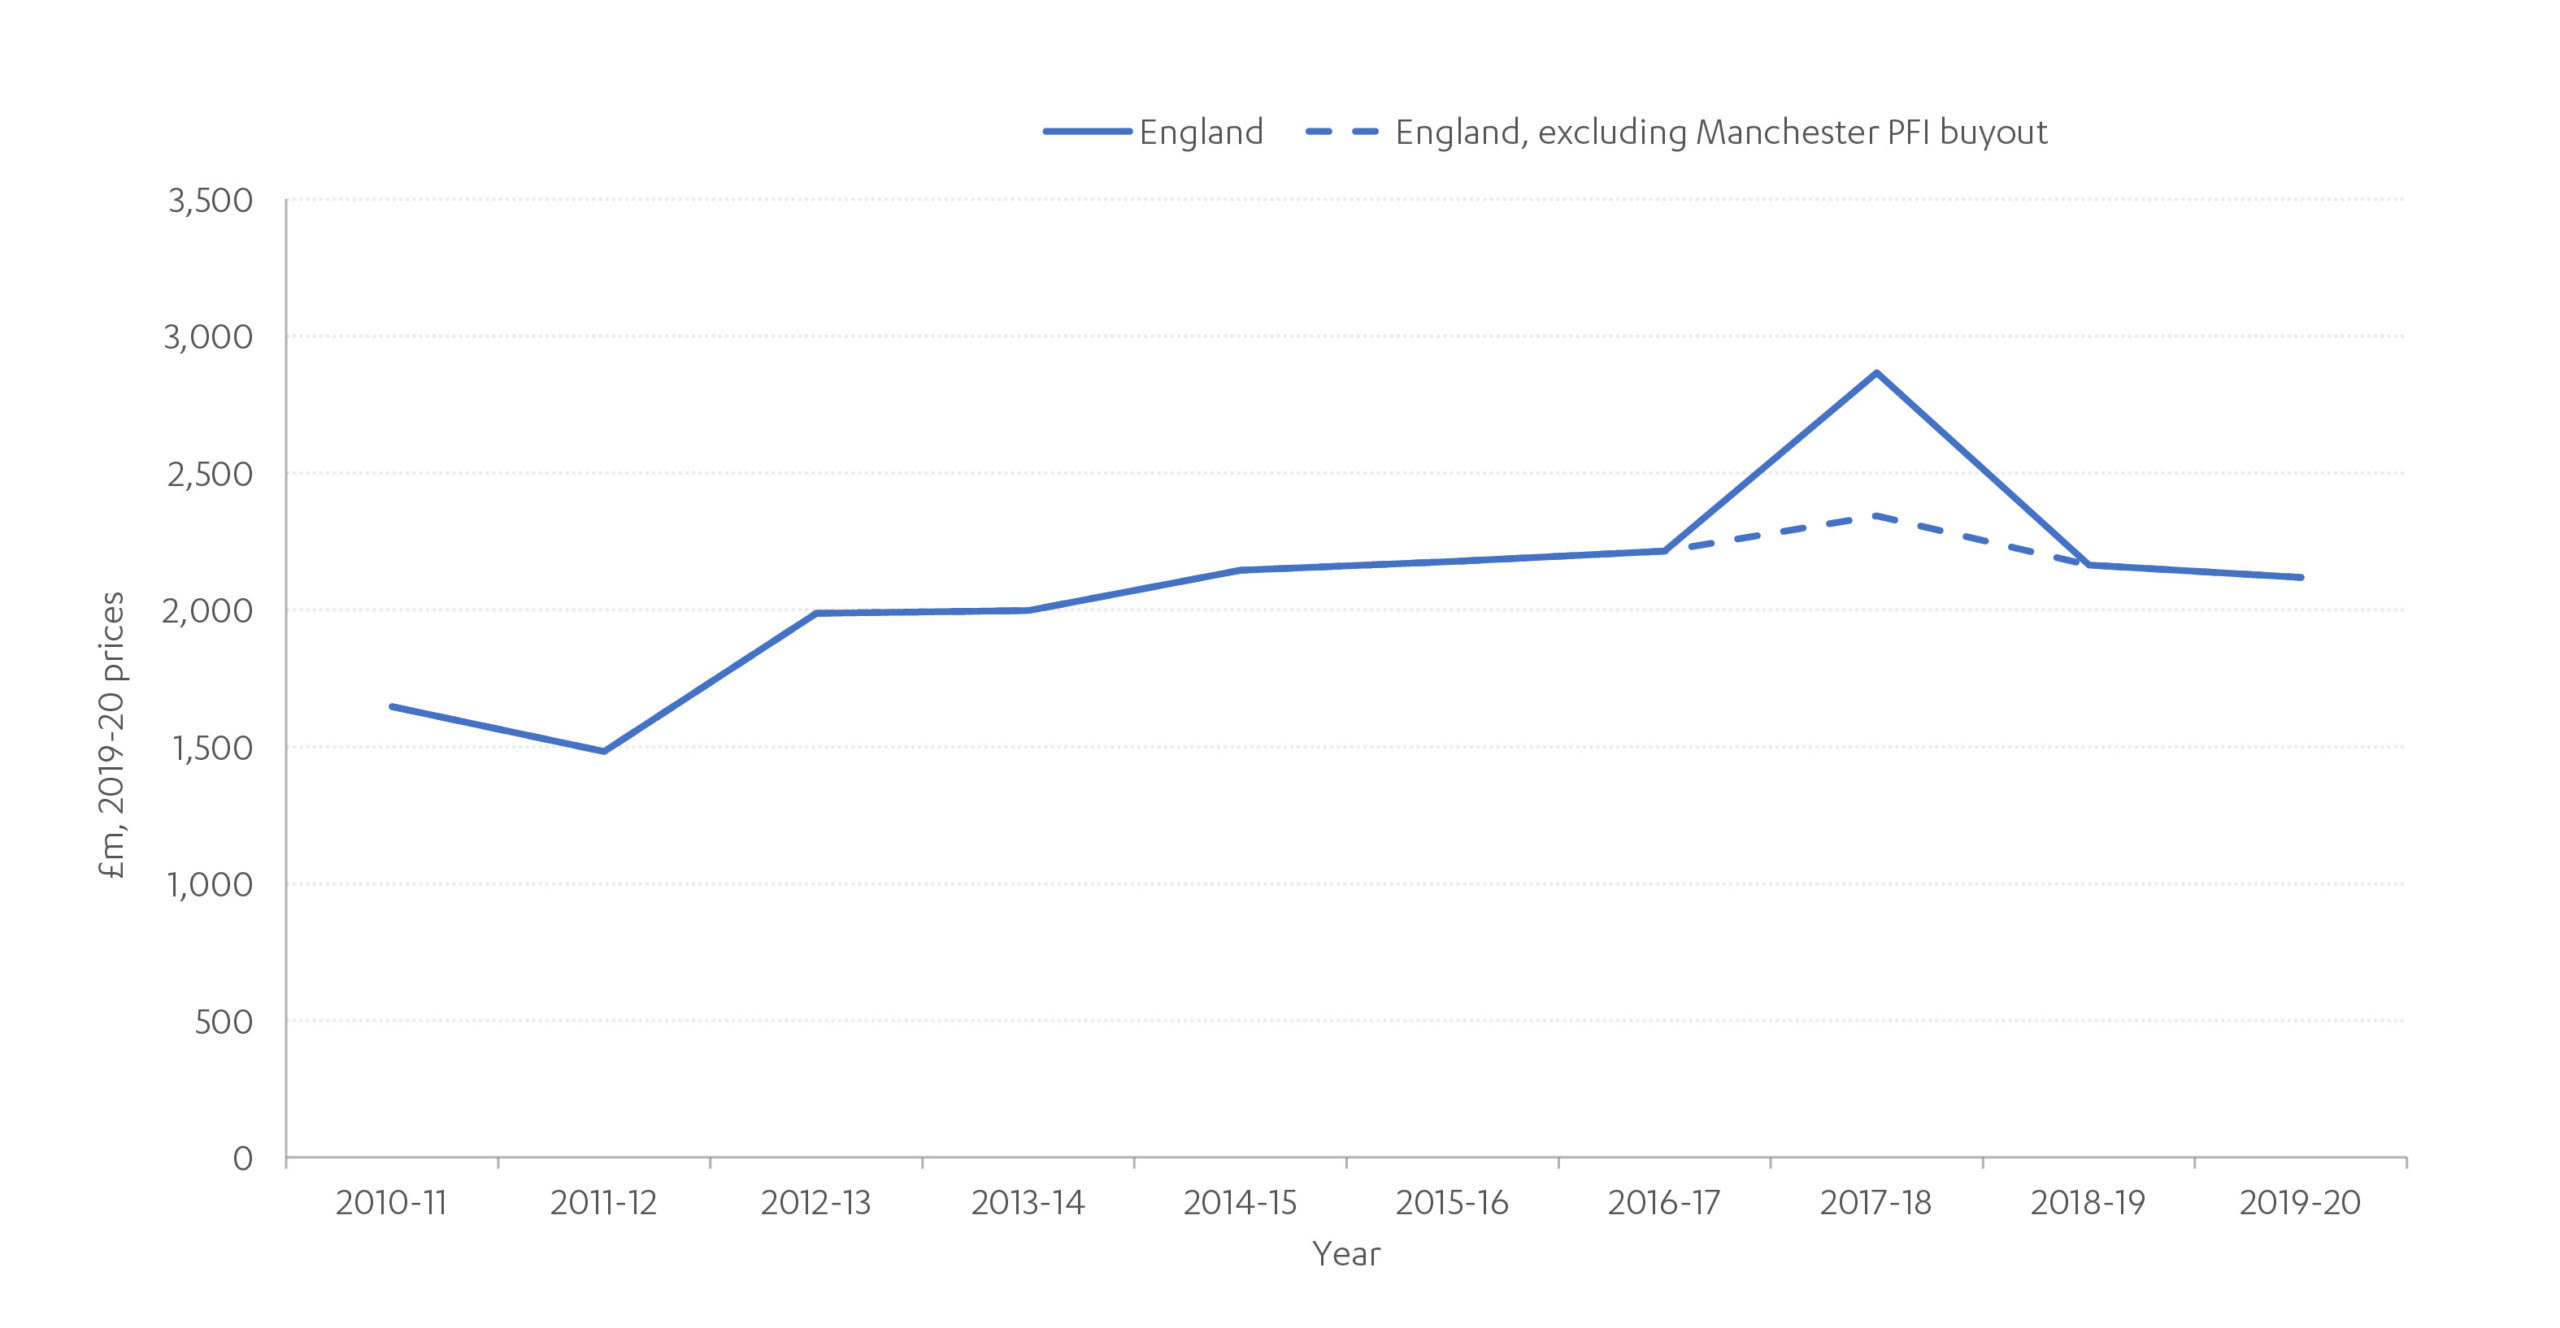
Source: Commission calculations (2021); HMT, Country and Regional Analysis
As is the case with funding sources, the multinational ownership structure of large waste infrastructure companies, and financial reporting exemptions for smaller companies, makes it hard to present data on private waste infrastructure investment in England.
Next Section: Performance
Overall, the performance of the waste sector remains stable. Total waste generated has increased over the last decade, but the growth in waste is considerably slower than the overall growth in the economy and much slower than pre-2010. However, recycling rates have plateaued since 2013 (see figure E.5).
Performance
Overall, the performance of the waste sector remains stable. Total waste generated has increased over the last decade, but the growth in waste is considerably slower than the overall growth in the economy and much slower than pre-2010. However, recycling rates have plateaued since 2013 (see figure E.5).
Greenhouse gas emissions from waste have reduced substantially since their highest point in 1996, as biological waste has been diverted from landfill, reducing methane emissions. However, since around 2015, emissions have begun to increase as energy from waste emissions has grown. Further progress on greenhouse gas reduction will be needed to meet net zero emissions by 2050.
The Local Government Association satisfaction poll on waste services shows customers were most satisfied in 2013, but satisfaction has stayed relatively consistent since (see figure E.7).26
As noted in the funding and finance section, a lack of systematic data across the waste sector makes it difficult to assess performance. It also results in issues with forecasting the future need for waste assets. The Commission recommended a common data reporting framework for businesses handling commercial and industrial waste in the first Assessment,27 though this has not yet been translated into workable data.
Quality
Waste quality can be measured by the percentage of waste that is managed through a method further up the waste hierarchy, such as recycling.
In 2018, of the 187 million tonnes of waste treated, around half (96.5 million tonnes) was recycled or recovered, for example, treatment via recycling plants or energy from waste.28 In 2019-20, 43per cent of local authority collected waste in England was recycled.29
The government’s Resources & Waste Strategy set a target for 65 per cent of municipal waste to be recycled by 2035.30 Municipal waste is a wider category than local authority collected waste, including commercial waste with similar characteristics to household waste. Waste & Resources Action Programme (WRAP) reported that 42 million tonnes of municipal waste were generated in 2017 in England.31
Internationally comparable data are available for the recycling of municipal waste at UK level. Figure E.6 shows the UK lags behind the best performers.
The packaging producer responsibility arrangements operate on a UK wide basis. For the UK, 67 per cent of packaging was recycled in 2020, including 47 per cent of plastic packaging.32
Figure E.5: Local authority collected waste recycling rates have stagnated in recent years
England recycling rates from waste as collected by local authorities, from 2000 to 2020
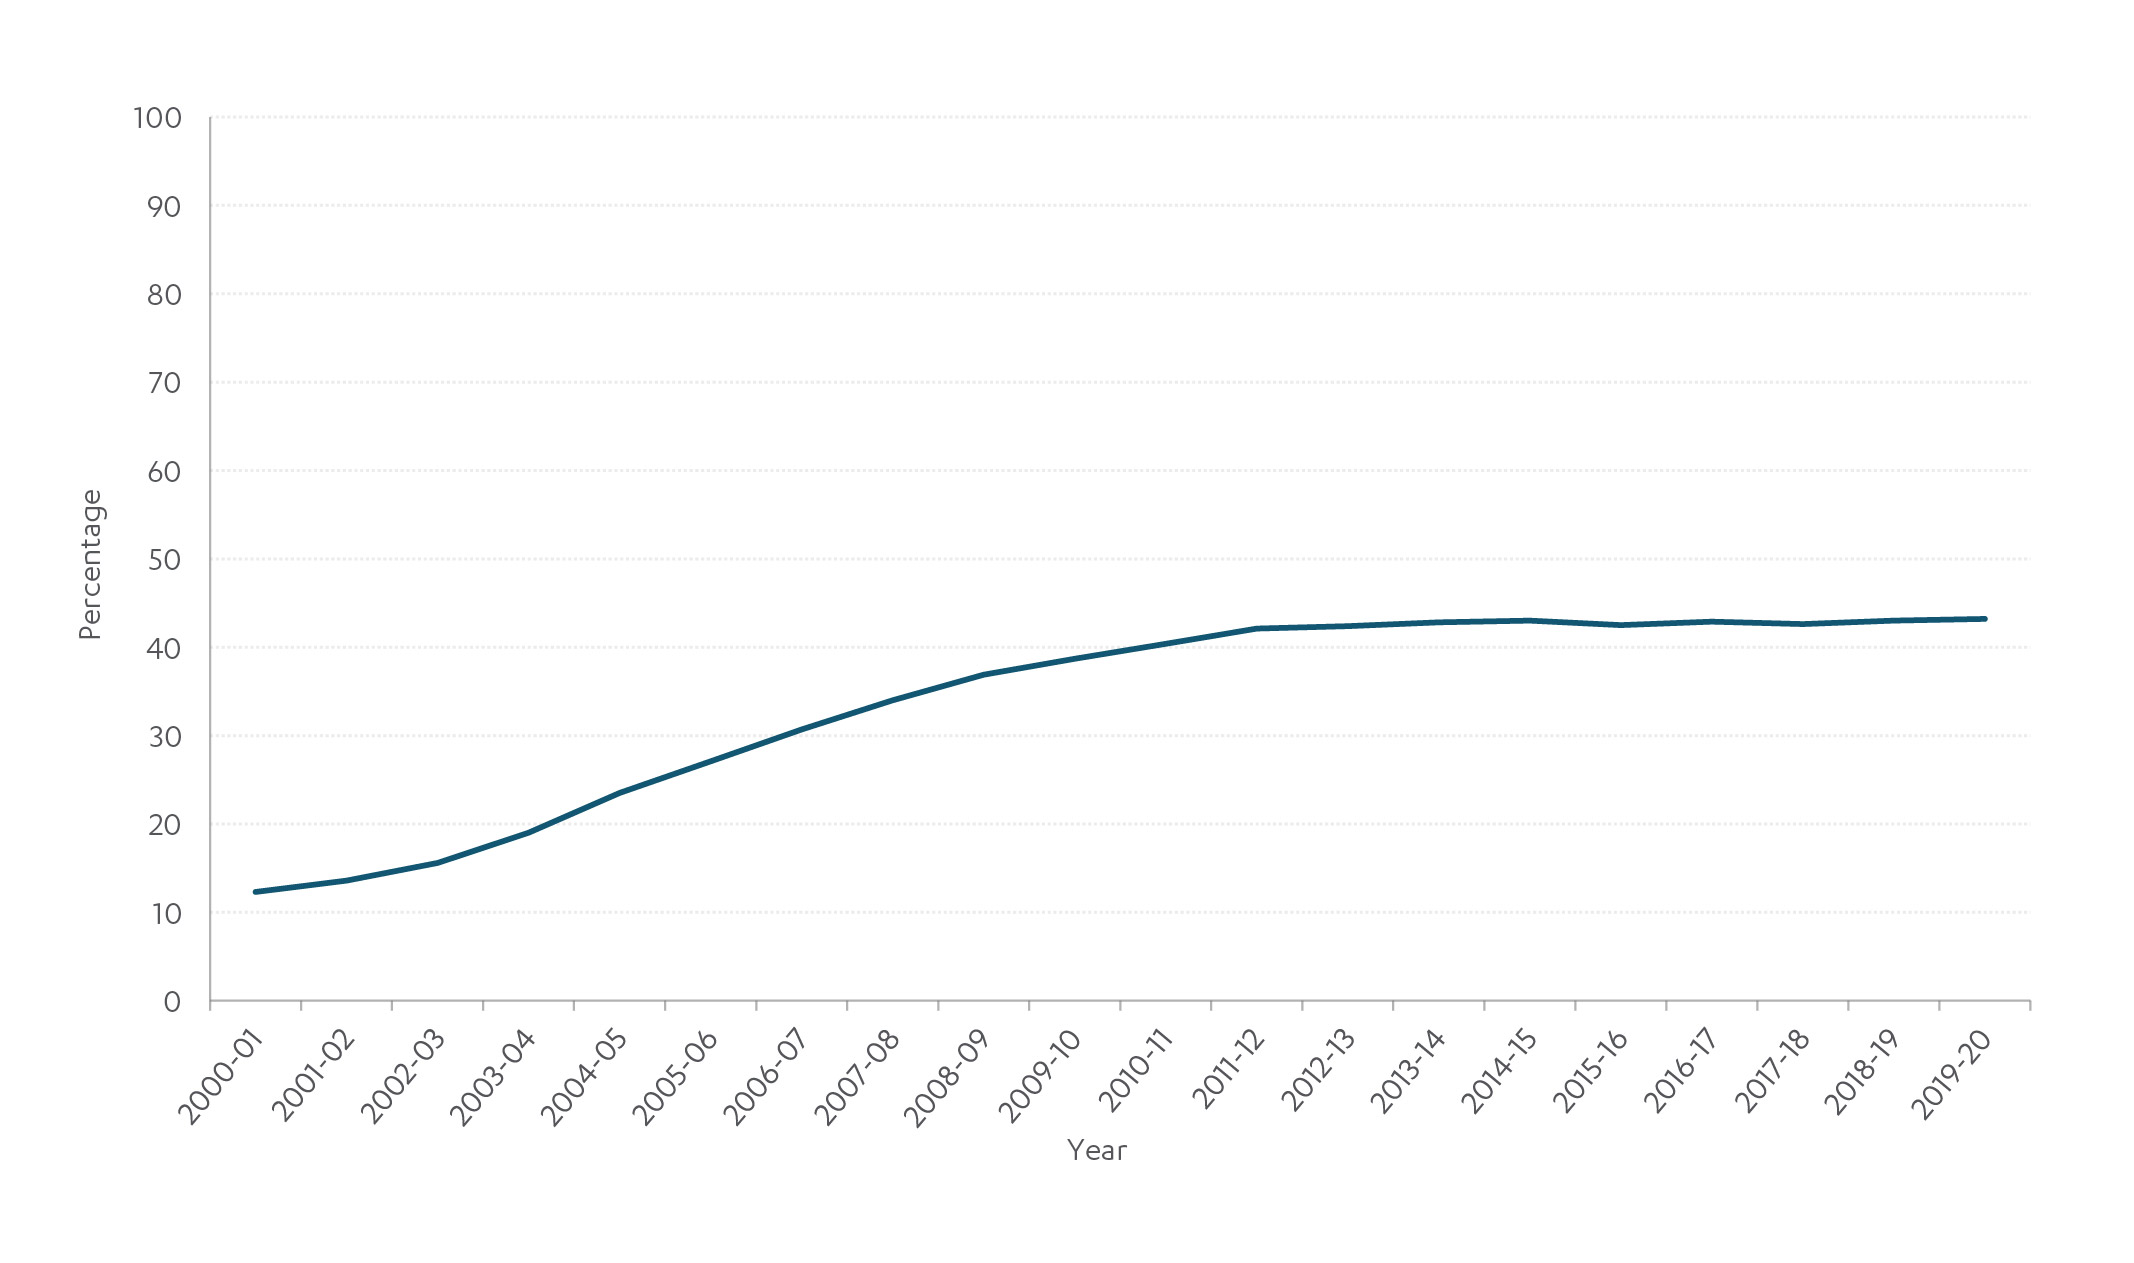
Source: Department for Environment, Food and Rural Affairs (2021), ENV23 – UK Statistics on Waste
Although the amount of waste that is recycled can be measured, there is a lack of publicly available data on the capacity of waste recycling infrastructure.33 This makes it difficult to understand if there is adequate capacity for recycling target increases, or if more infrastructure will be required in the future.
Figure E.6: The UK lags behind the best performers at recycling
Municipal recycling rates across comparative countries from 2008 and 2018
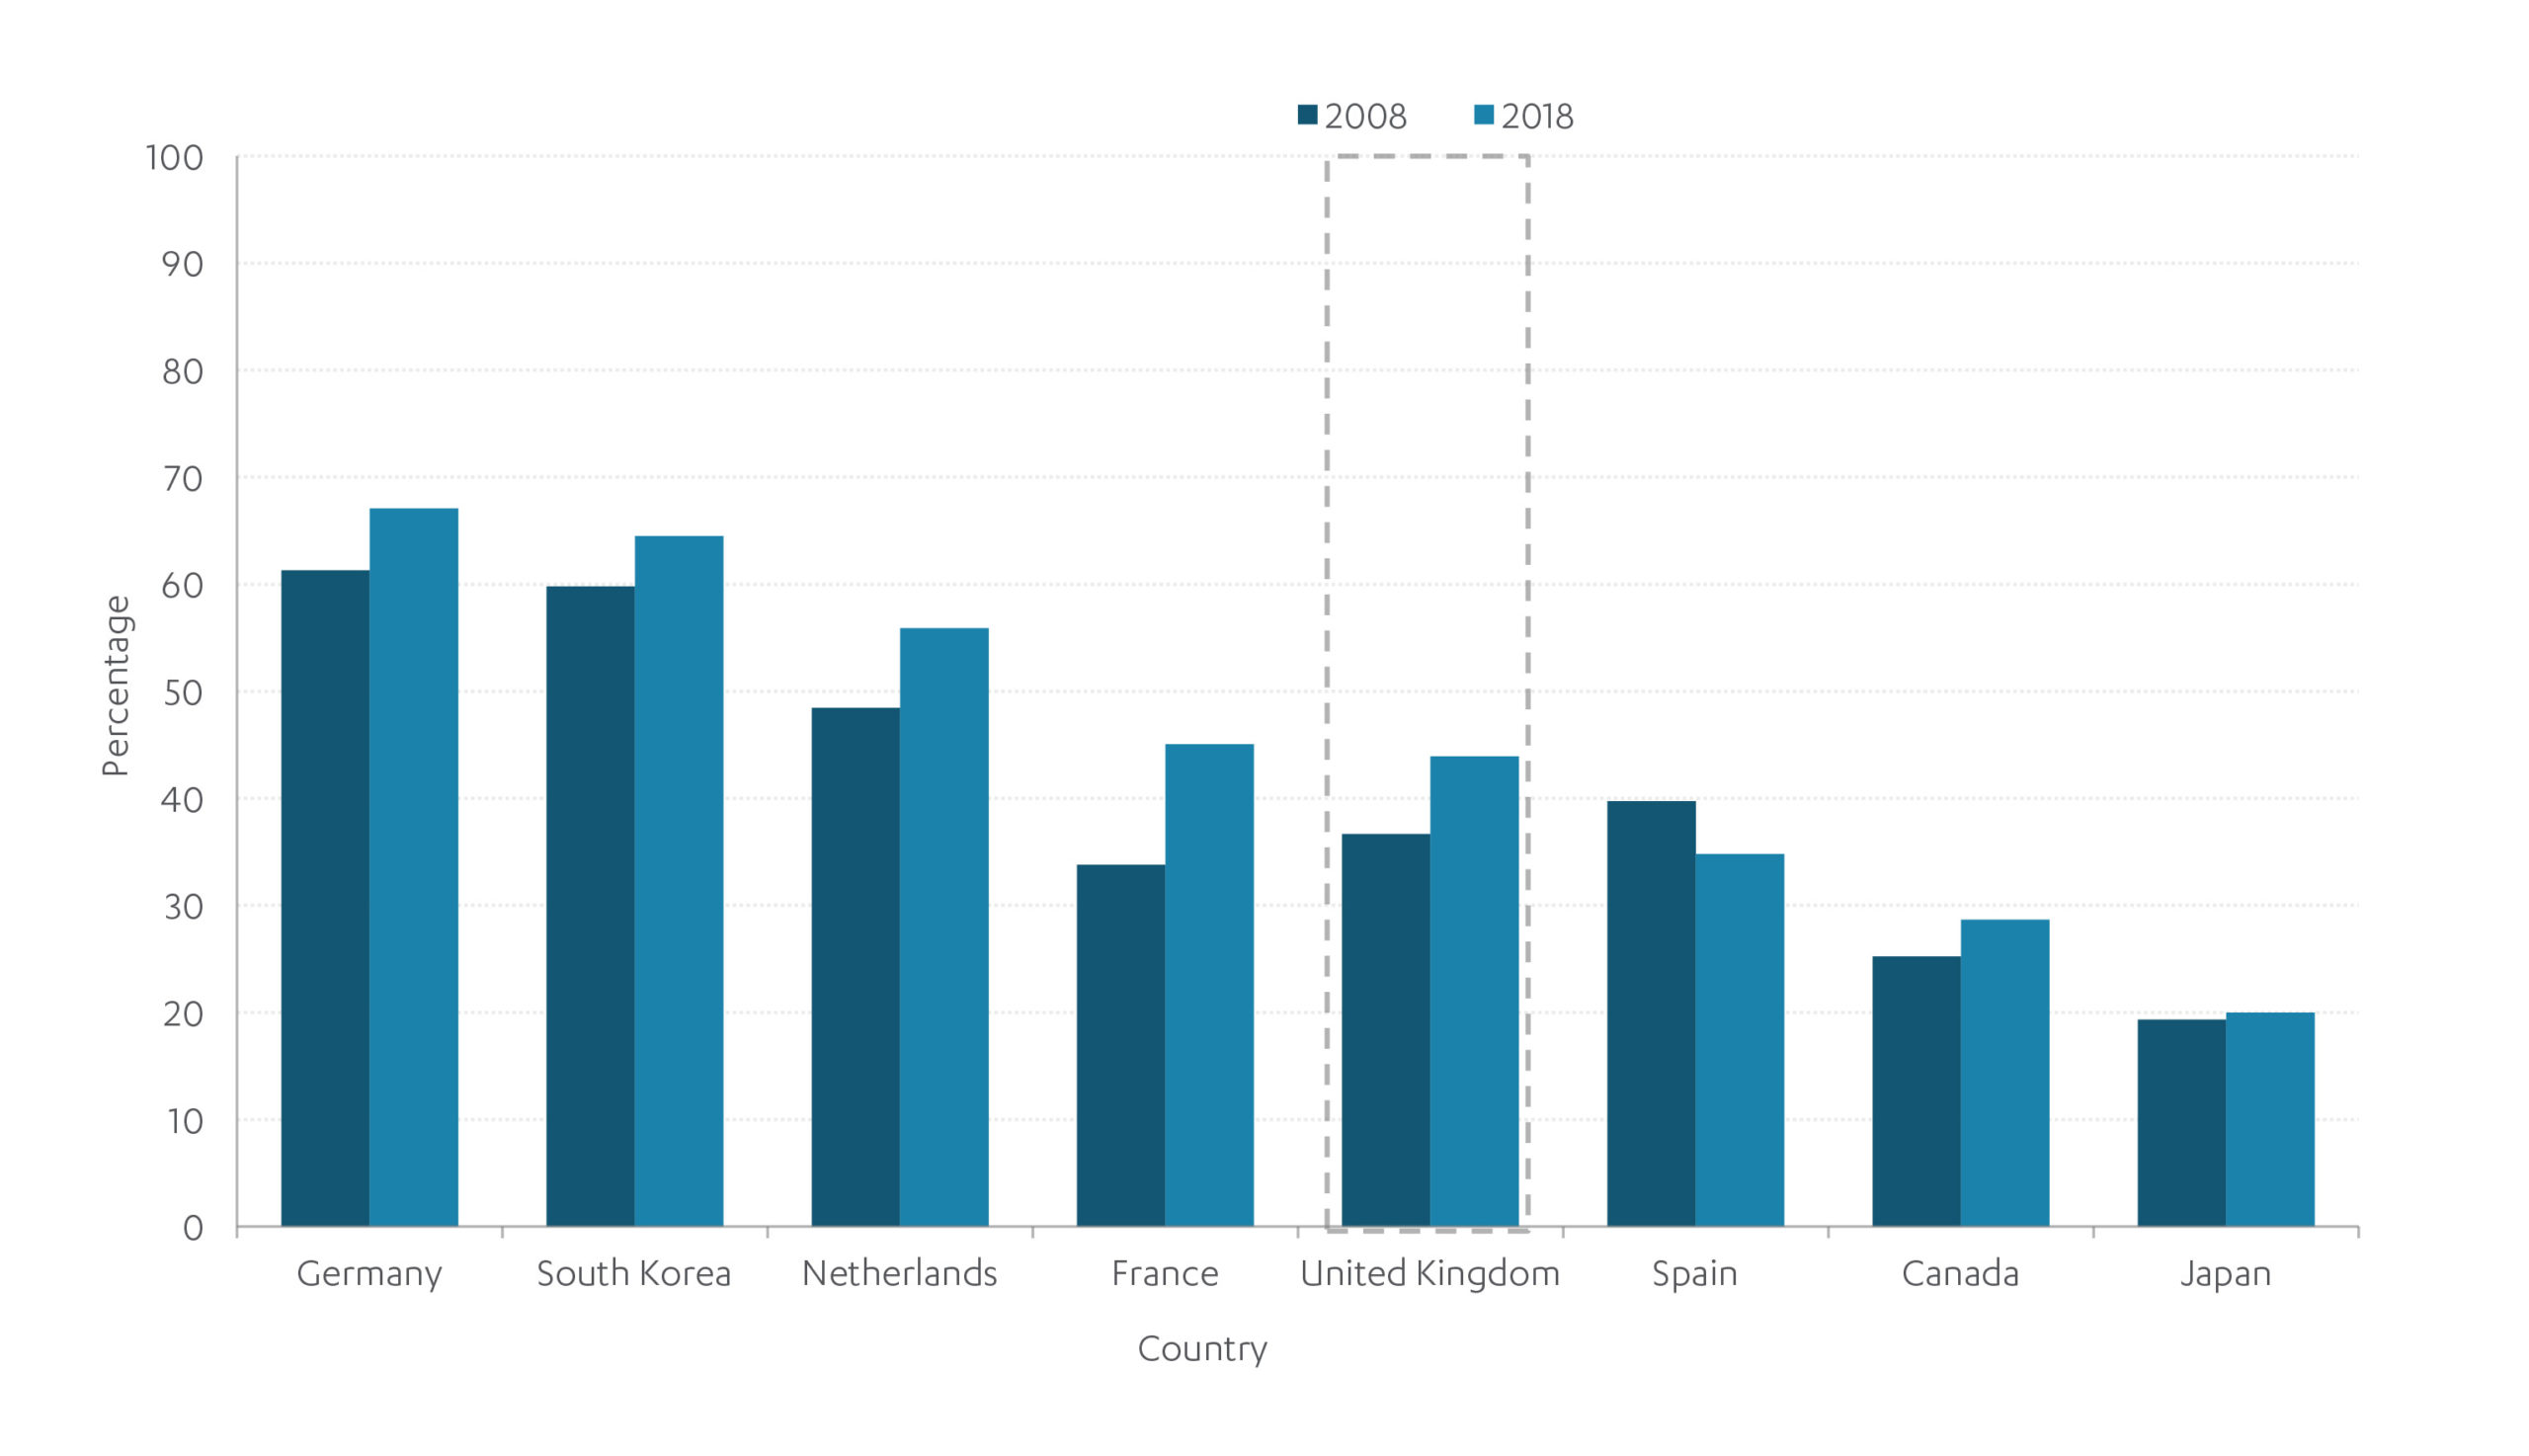
Source: OECD (2021), Municipal Waste, Generation and Treatment34; Eurostat35
In the Commission’s social research, conducted in June 2021, solid waste management was ranked the second lowest out of the Commission six infrastructure sectors in terms of levels of confidence in meeting people’s needs in the next 30 years. However, that has grown since the 2017 assessment, from 58 per cent to 69 per cent of people surveyed having confidence in solid waste infrastructure meeting their long term needs.36
Respondents also raised questions around the transparency of waste management processes (including whether household recycling was in fact recycled), experiences of abandoned waste management schemes and concerns around overconsumption and excess packaging.
These figures are consistent with polling from the Local Government Association, which has consistently shown high satisfaction rates with the waste sector.37
Figure E.7: 78 per cent of respondents in February 2020 were satisfied with waste collection services
Waste satisfaction results as per Local Government Association polling on resident satisfaction with councils
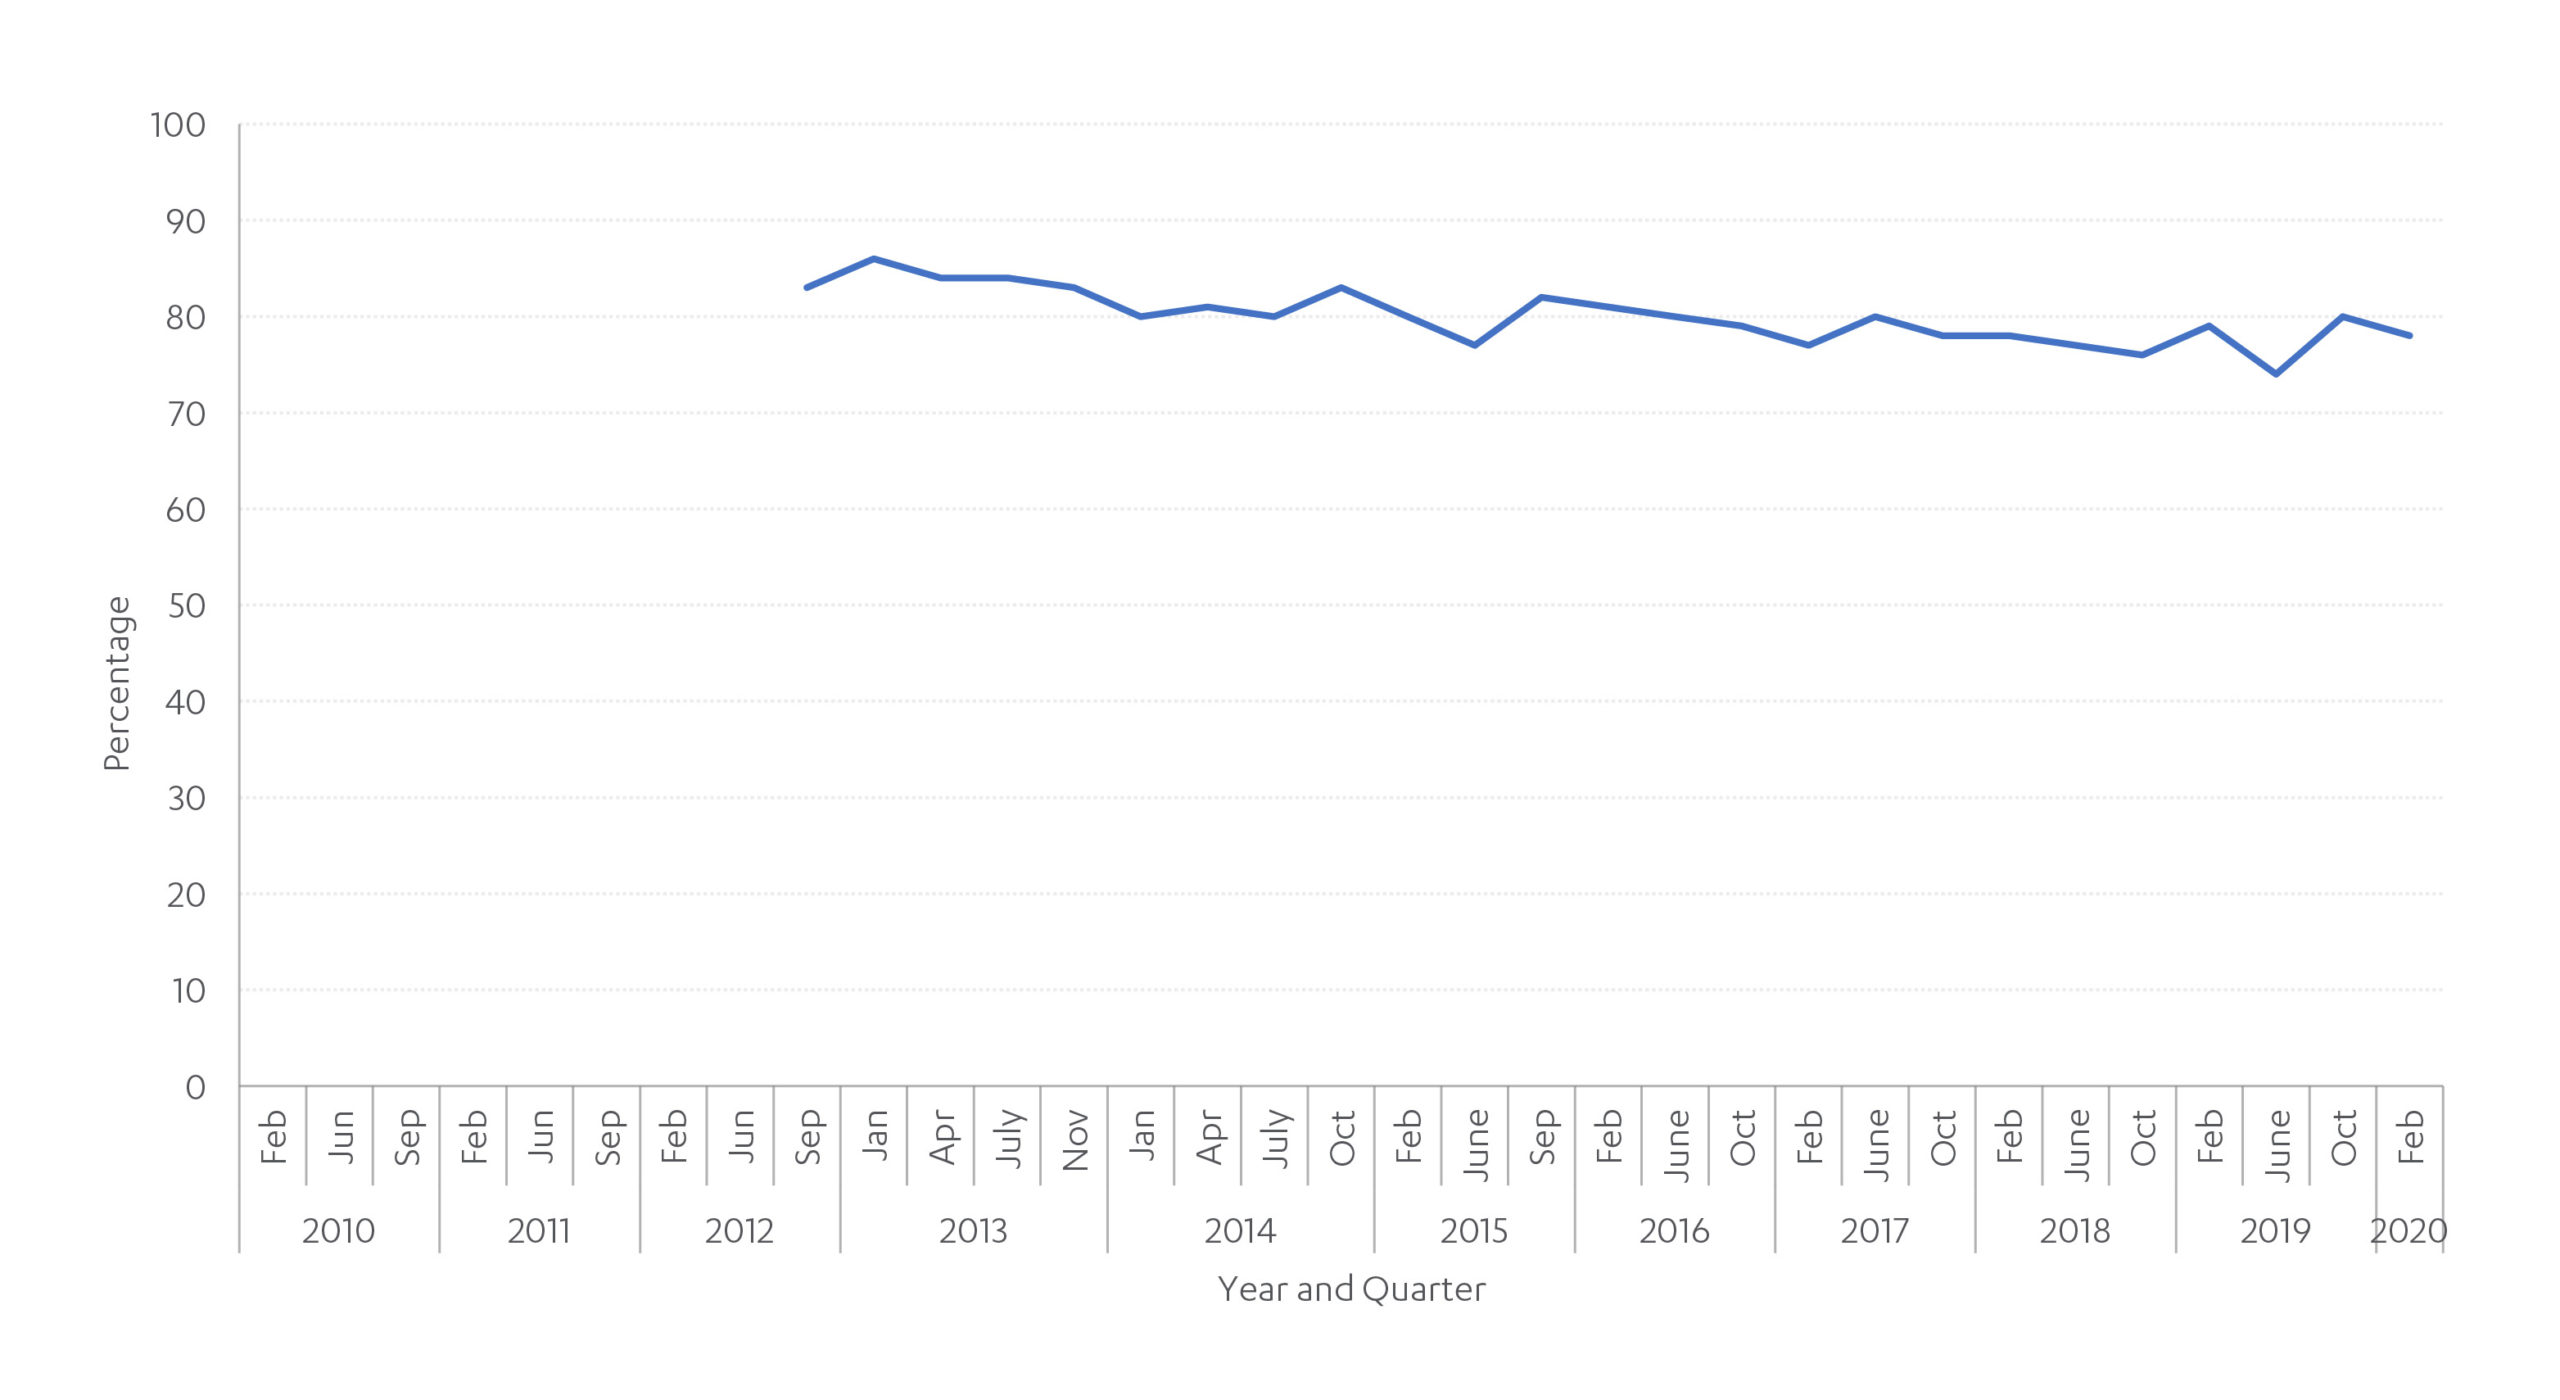
Source: Local Government Association (2021), Polling on resident satisfaction with councils: Round 28
Price
As the local authority collected waste sector is largely paid for via taxation, with the exception of local authority collected commercial waste, it is possible to calculate the average net revenue burden of waste management services for each household across England. Over the year 2020-21, households paid an average of £29 for recycling, £95 for waste disposal, £42 for waste collection, £31 for street cleaning (excluding highways) and £1 for waste minimisation, with £2 offset by income from trade waste per household.38 These prices have declined gradually over the last decade.
Figure E.8: Households pay the most for waste disposal out of any waste management function
Net revenue burden of waste management services per household, according to local authorities, England 2010-11 to 2019-20
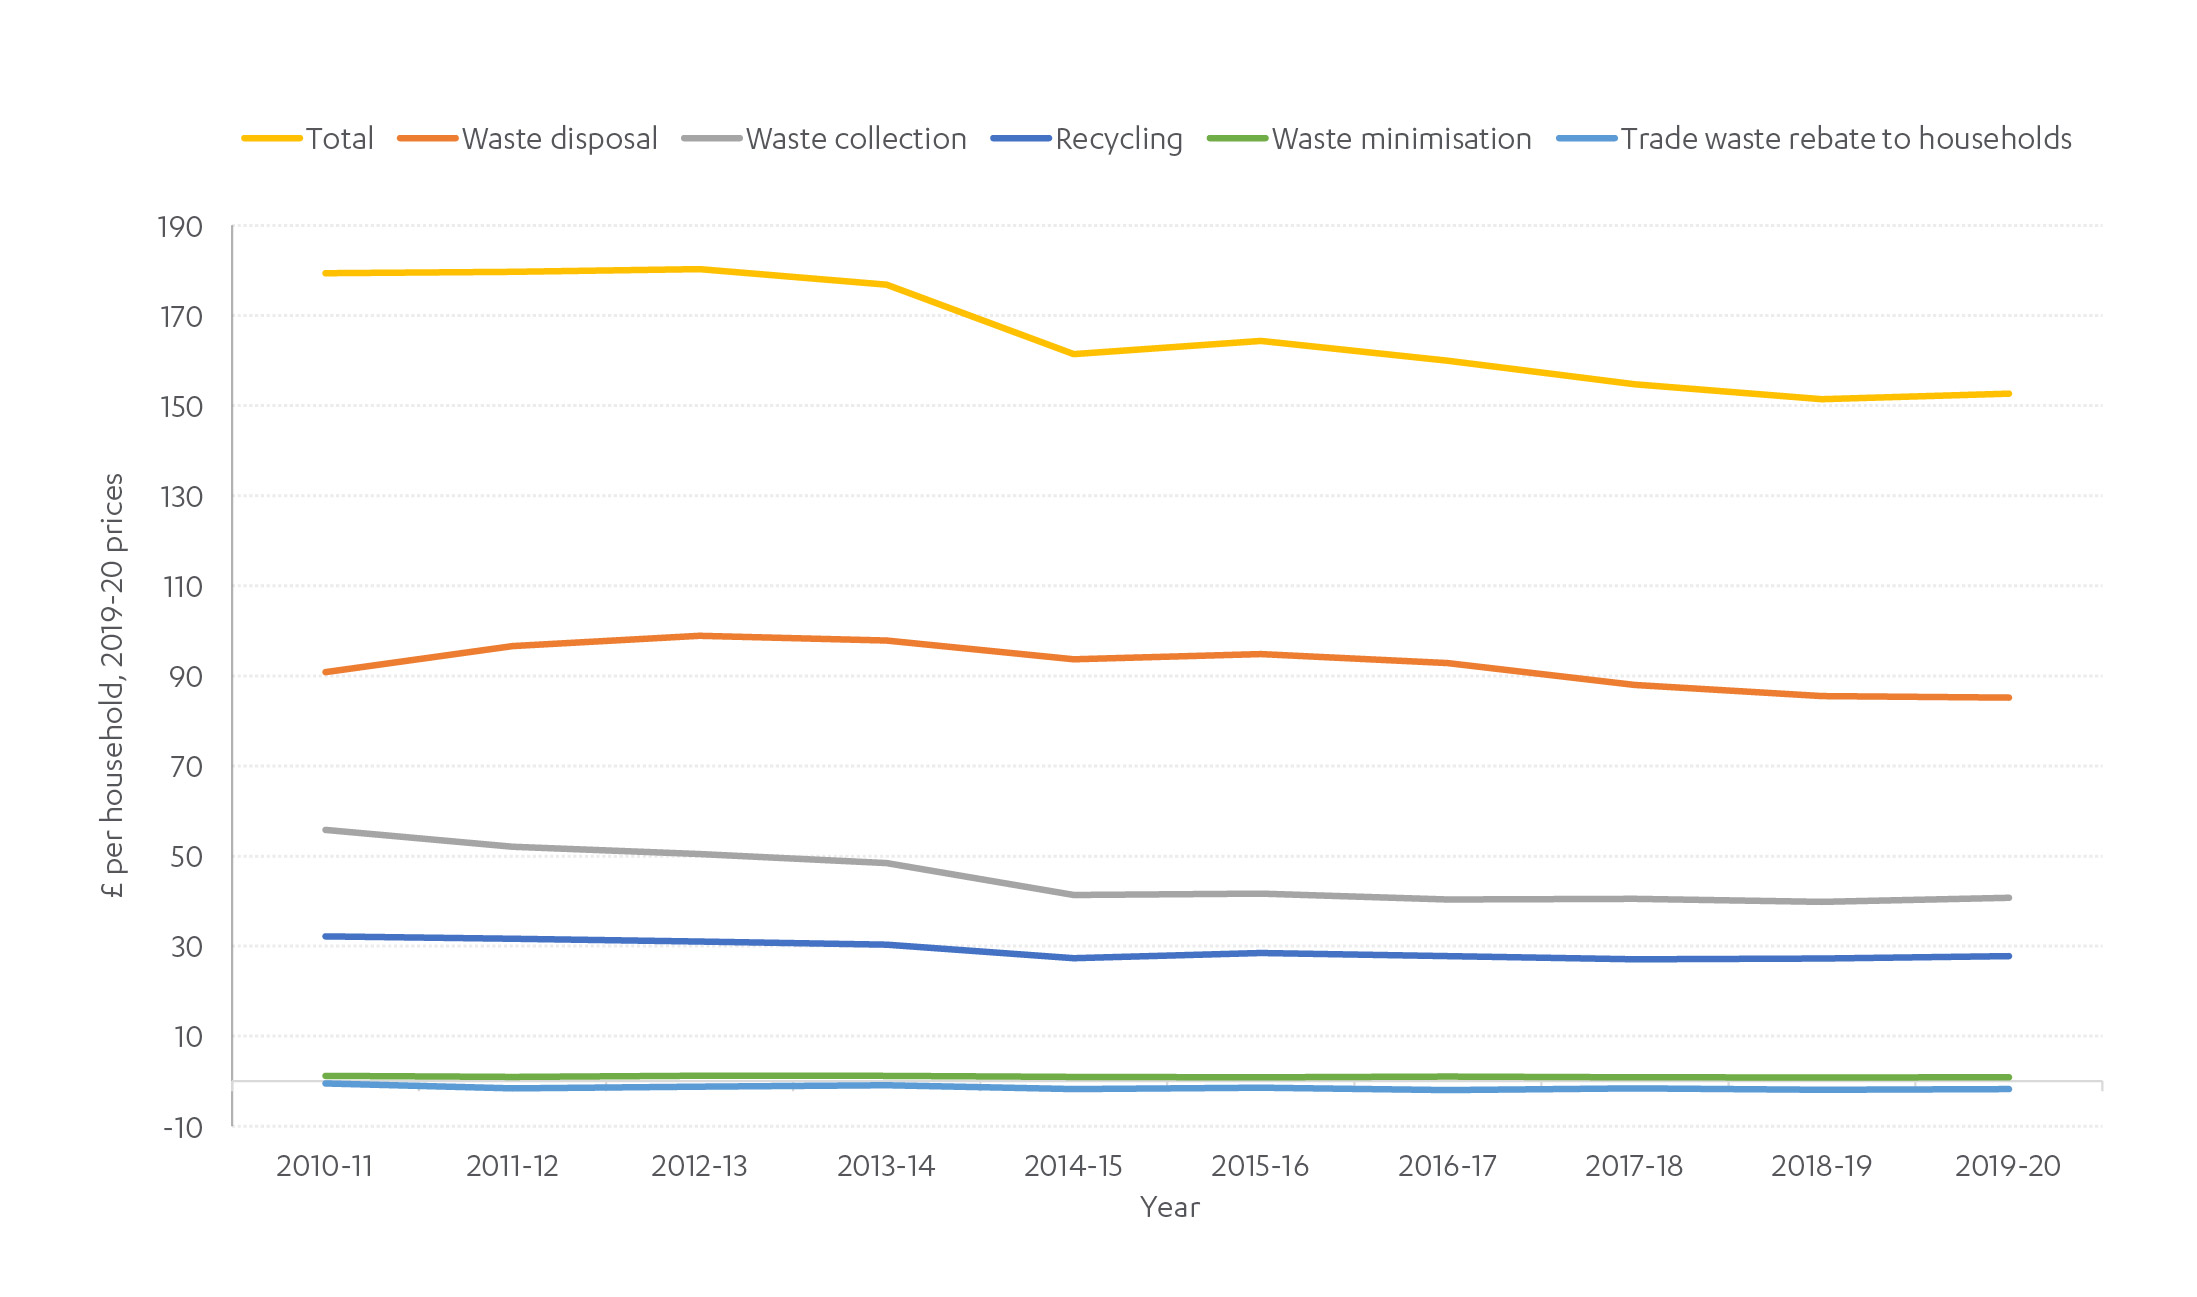
Source: MHCLG (2021), Local authority revenue expenditure and financing England: annual budget individual local authority data
Environment
The main measures of environmental impact across the sector are emission levels and pollution. The waste sector, including energy from waste facilities, generated just over 4 per cent of total UK greenhouse gas emissions in 2019, standing at just over 20MtCO2e.39 Of this, 14 MtCO2e came from landfill sites, around 5 MtCO2e from energy from waste facilities, and 2 MtCO2e from incineration, composting, anaerobic digestion and other forms of mechanical biological treatment.40 These domestic figures do not account for emissions from exporting waste.
Waste sector emissions rose in the early 1990s due to an increase in methane emissions from landfill but fell by 46 per cent between 2008 and 2018.41 This significant reduction began with the introduction of the UK’s landfill tax, which financially incentivised the diversion of biodegradable waste from landfill.42 However, methane from landfill is still the largest source of greenhouse gas emission from the waste sector.
The significant decrease in local authority waste going to landfill has been accompanied by a greater proportion being incinerated for energy recovery rather than recycled or composted in England. This has caused waste emissions to rise since 2014, as total emissions increased from 19.5 MtCO2e in 2014 to 22 MtCO2e in 2019.43 However, emissions from energy recovery plants are still significantly lower than landfill and displace emissions that would otherwise be created by alternative forms of electricity generation.44 The government has accepted the Commission’s recommendation to establish separate food waste collection for households and businesses, to enable the production of biogas, by 2025. This will ensure more biodegradable municipal waste is diverted to anaerobic digestion plants, further reducing emissions from landfill and incineration.45
Figure E.9: Waste emissions have decreased since 1990 with a move away from landfill, but have increased since 2014 as energy from waste emissions rise
Waste emissions broken down by waste disposal method, 1990 to 2021, UK
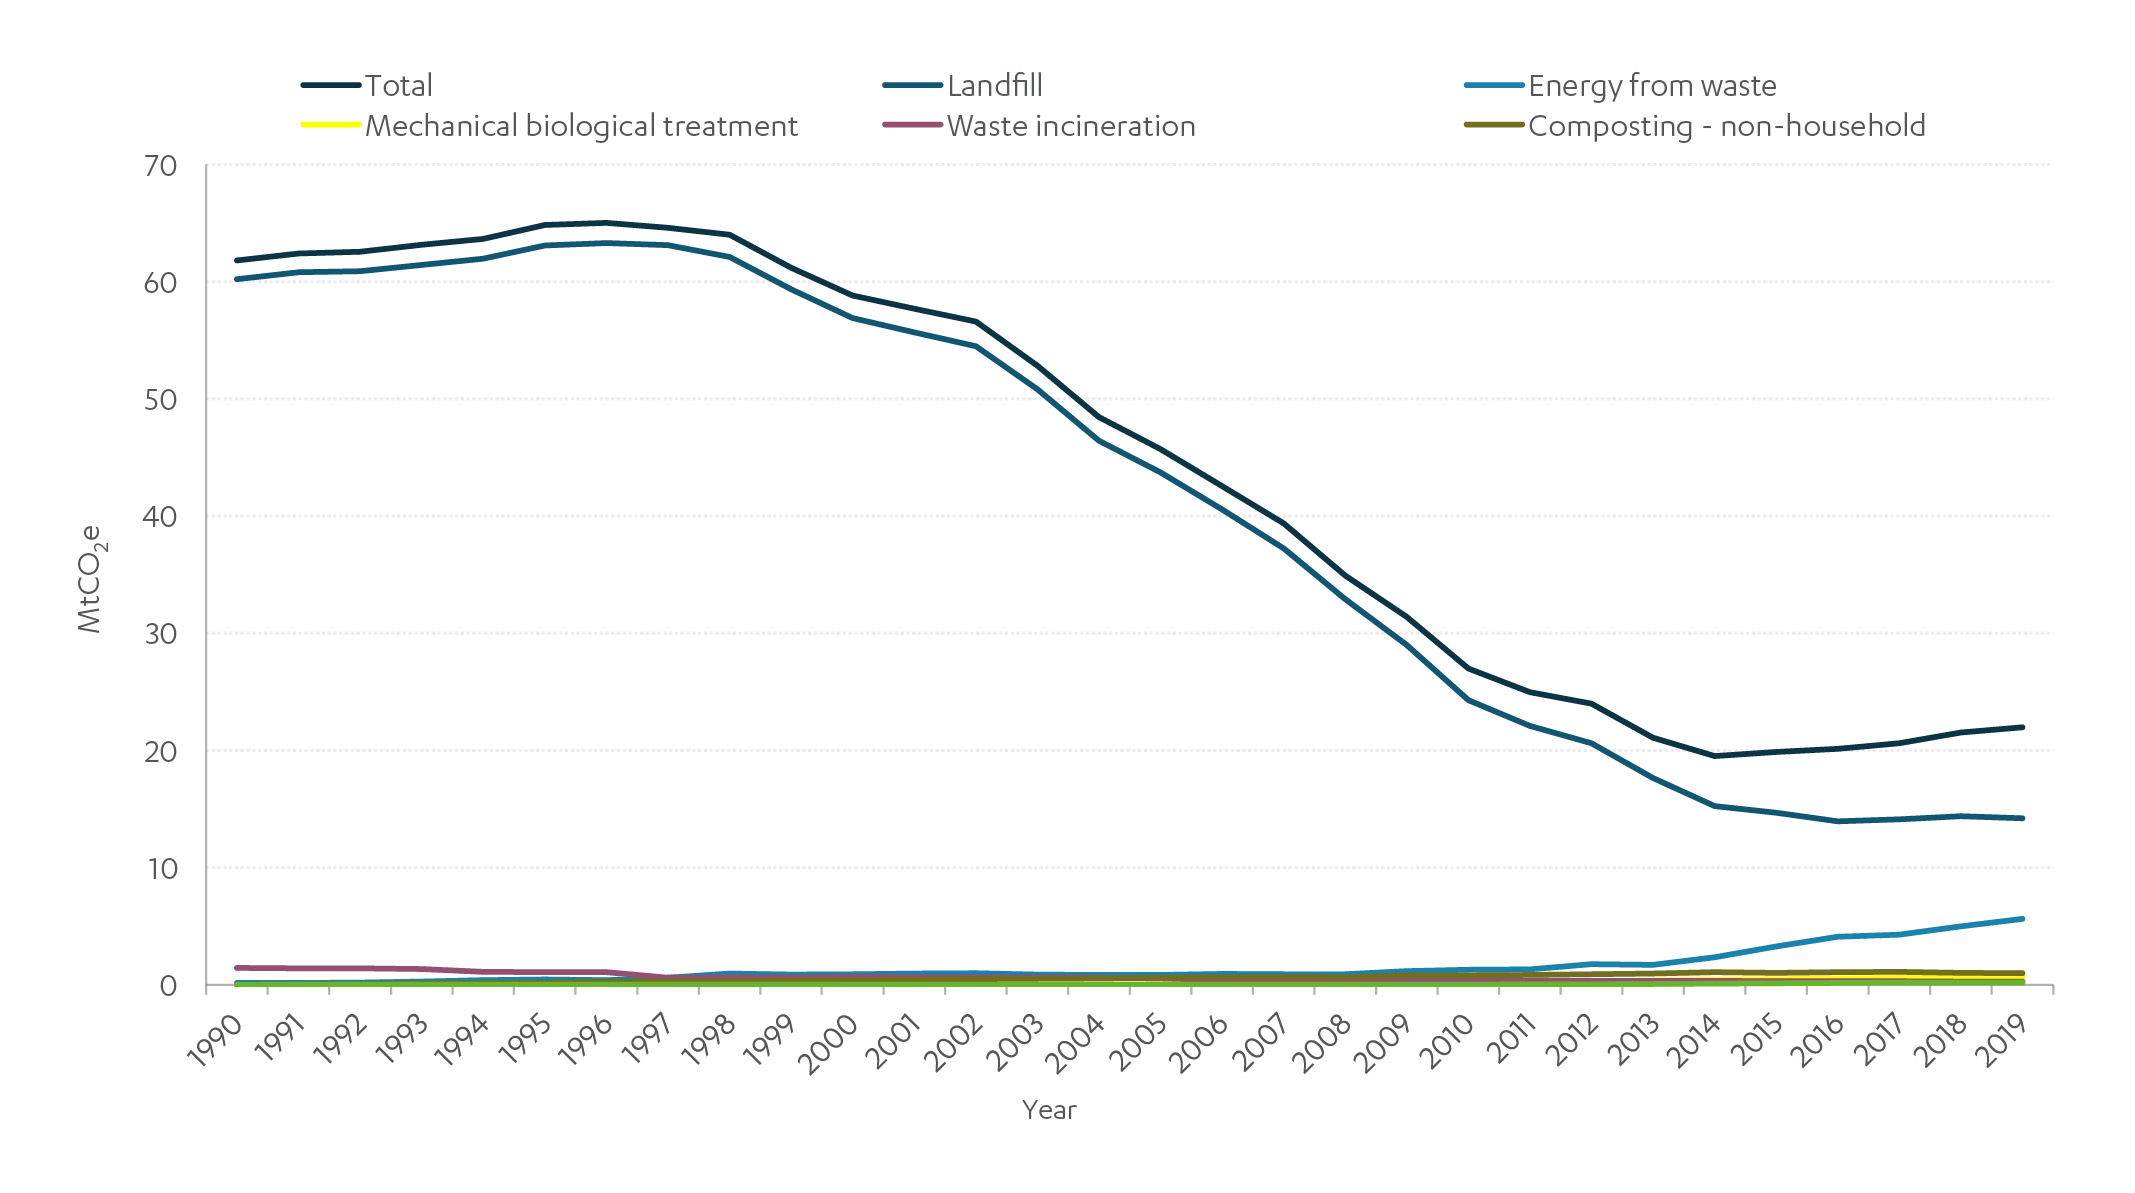
Source: BEIS (2021), Final UK greenhouse gas emissions national statistics
Poor waste management can have other negative environmental impacts. The Environment Agency reported 70 serious pollution incidents caused by waste management activities in England in 2019. There has been a decrease in serious pollution incidents since 2015, with an 11 per cent decrease between 2018 and 2019.46 This overall downward trend is due to significant improvements across waste treatment and biowaste. However, there have been no improvements to pollution incidents from landfill, and incidents from incinerators have marginally increased.47
Resilience
There is little data available to assess the resilience of the waste sector, although local authorities have well developed and tested contingency plans for their collections, as do the larger companies. Some waste infrastructure is at risk of floods or coastal erosion, which could in turn exacerbate pollution.48 49 Waste services could also be affected by interruptions to other infrastructure services including transport and energy,50 as well as global material prices.
Labour supply is also a potential risk to waste services, highlighted throughout the pandemic and current issues in relation to HGV driver shortages. The government recently provided non-statutory guidance to help local authorities and other waste collectors in England prioritise waste collection services.51 This prioritised maintaining residual waste (black bag) collections to prevent waste from building up and protect public health. Several local authorities released warnings for delayed collections due to staff shortages caused by the Covid-19 pandemic.
Next Section: Looking ahead
The net zero target is a key driver for change in the waste sector over the next three decades. An increasing reliance on energy from waste, alongside stagnating recycling levels, will make it difficult to achieve net zero emission targets without carbon capture and storage technologies (see Chapter 2: Reaching net zero).
Looking ahead
The net zero target is a key driver for change in the waste sector over the next three decades. An increasing reliance on energy from waste, alongside stagnating recycling levels, will make it difficult to achieve net zero emission targets without carbon capture and storage technologies (see Chapter 2: Reaching net zero).
The Environment Act is the vehicle for delivering the government’s 25 Year Environment Plan. The Act gives the government powers to set long term, legally binding environmental targets. For waste, these include the delivery of consistent and frequent recycling collections across England, ending the current geographical variations.52 It will also ensure councils operate weekly separate food waste collections, diverting some food waste away from landfill and incineration.53
The government has also committed to the Circular Economy Package, which sets a target to recycle 65 per cent of municipal waste by 2035 and to have no more than ten per cent of municipal waste go to landfill by 2035.54 However, the Commission recommended this target should be met by 2030, as well as a 75 per cent target for plastic recycling for the same date. The Commission also recommended clear, two symbol labelling (recyclable or not recyclable) across the UK by 2022. While the government did not accept this recommendation, they have said they will aim to simplify labelling through schemes such as Extended Producer Responsibility.55
In addition to recycling targets, changing waste composition will need to be monitored, as this creates the need to develop solutions which are capable of treating new materials and different compositions.
It is likely that more stringent rules to restrict waste exports will be introduced in the near future. The UK exported 537,000 tonnes of plastic waste in 2020.56 However, the Environment Act contains powers which would allow the government to regulate, ban or restrict waste imports and exports, enabling the delivery of a commitment in the 2019 Conservative Party Manifesto to ban the export of plastic waste to countries outside the OECD grouping.57 Other countries have already done so: in January 2021, the EU banned the export of plastic waste from the EU to non-OECD countries, except for clean plastic waste sent for recycling.58 If waste exports are restricted, this could have significant implications for domestic waste capacity.
Next Section: Challenges and opportunities
The second Assessment will carry out new analysis and develop recommendations on one challenge that will affect the waste sector:
Challenges and opportunities
The second Assessment will carry out new analysis and develop recommendations on one challenge that will affect the waste sector:
Challenge 7: Waste and the circular economy – the Commission will examine the role of the waste sector in enabling the move towards a more circular economy.
References
- Department for the Environment, Food and Rural Affairs (2011), Waste Hierarchy Guidance
- UK government (2020), Circular Economy Package policy statement
- Department for Environment, Food and Rural Affairs (2021), ENV23 – UK Statistics on Waste
- Department for Environment, Food and Rural Affairs (2021), UK Statistics on Waste
- Department for Environment, Food and Rural Affairs (2021), ENV23 – UK Statistics on Waste
- Department for Environment, Food and Rural Affairs (2019), Statistics on waste managed by local authorities in England in 2018/19
- Department for Environment, Food and Rural Affairs (2021), ENV23 – UK Statistics on Waste
- Department for Environment, Food and Rural Affairs (2021), UK Statistics on Waste
- Department for Environment, Food and Rural Affairs (2021), ENV18- Local authority collected waste: annual results tables
- UK Legislation, Environment Protection Act 1990
- Department for Environment, Food and Rural Affairs (2018), Waste duty of care code of practice
- Environment Agency (2021), Waste: environmental permits
- Statista (2021), Revenues of leading UK waste management service companies 2019/2020
- Metro Waste (2019), History of Waste Management
- Charted Institute of Wastes Management, Centenary History of Waste and Waste Managers in London and South East England
- Charted Institute of Wastes Management, Centenary History of Waste and Waste Managers in London and South East England
- Charted Institute of Wastes Management, Centenary History of Waste and Waste Managers in London and South East England
- The Trustee of the Wellcome Trust (2015), The Development of Waste Management in the UK c.1960–c.2000
- The Trustee of the Wellcome Trust (2015), The Development of Waste Management in the UK c.1960–c.2000
- Department for Environment, Food and Rural Affairs (2018), Resources & Waste Strategy
- HMT (2021), Public Expenditure Statistical Analyses
- Ministry of Housing, Communities & Local Government (2020), Local authority revenue expenditure and financing England: 2019 to 2020 individual local authority data – outturn
- Environment Agency (2020), Packaging waste: producer responsibility
- Infrastructure Projects Authority (2018), Private Finance Initiative and Private Finance 2 projects: 2018 summary data
- Commission calculations (2021), HMT, Country and Regional Analysis, 2013, 2015 and 2020
- Local Government Association (2021), Polling on resident satisfaction with councils: Round 28
- National Infrastructure Commission (2018), National Infrastructure Assessment
- Department for Environment, Food and Rural Affairs (2021), UK Statistics on Waste
- Department for Environment, Food and Rural Affairs (2021), Statistics on waste managed by local authorities in England in 2019/20
- Department for Environment, Food and Rural Affairs (2018), Resources & Waste Strategy for England
- Waste and Resources Action Programme (2017) National Municipal Waste Composition, England
- Department for Environment, Food and Rural Affairs (2021), ENV23 – UK Statistics on Waste
- Department for Environment, Food and Rural Affairs (2021), UK Statistics on Waste
- OECD (2021), Municipal Waste, Generation and Treatment
- Eurostat (2021), Recycling rate of municipal waste
- PWC (2021), NIA2 Social Research
- Local Government Association (2021), Polling on resident satisfaction with councils: Round 28
- Suez (2019), The economics of change in the resources and waste sector
- The Commission has compiled waste emissions figures by removing wastewater (see Annex D: Water and Wastewater) from totals and adding in energy from waste emissions. Energy from waste has been removed from the energy emissions totals (see Annex B: Energy). Department for Business, Energy & Industrial Strategy (2021), 2019 UK greenhouse gas emissions: final figures – data tables; Department for Business, Energy & Industrial Strategy (2021), 2019 UK greenhouse gas emissions by Standard Industrial Classification
- The Commission has compiled waste emissions figures by removing wastewater (see Annex D: Water and Wastewater) from totals and adding in energy from waste emissions. Energy from waste has been removed from the energy emissions totals (see Annex B: Energy). Department for Business, Energy & Industrial Strategy (2021), 2019 UK greenhouse gas emissions: final figures – data tables; Department for Business, Energy & Industrial Strategy (2021), 2019 UK greenhouse gas emissions by Standard Industrial Classification
- The Climate Change Committee (2020), Sector Summary of Waste
- The Climate Change Committee (2020), Sector Summary of Waste
- Department for Business, Energy & Industrial Strategy (2021), 2019 UK greenhouse gas emissions: final figures – data tables; Department for Business, Energy & Industrial Strategy (2021), 2019 UK greenhouse gas emissions by Standard Industrial Classification
- Department for Environment, Food and Rural Affairs (2014), Energy from waste, A guide to the debate
- Department for Business, Energy and Industrial Strategy (2021), Net Zero Strategy: Build Back Greener
- Environment Agency (2021), Regulating for people, the environment and growth, 2019
- Environment Agency (2021), Regulating for people, the environment and growth, 2019
- Flood and Coastal Erosion Risk Management Research and Development Programme & the EA (2021), Landfill and contaminated land at risk from coastal erosion
- Environment Agency (2003), Increasing the climate resilience of waste infrastructure
- AEA (2012), Increasing the climate resilience of waste infrastructure
- Department for Environment, Food and Rural Affairs (2021), Waste collection services: guidance for local authorities
- Department for Environment, Food and Rural Affairs (2021), September 2021: Waste and resource efficiency factsheet (part 3)
- Department for Environment, Food and Rural Affairs (2021), September 2021: Waste and resource efficiency factsheet (part 3)
- UK government (2020), Circular Economy Package policy statement
- Department for Environment, Food and Rural affairs (2018), Our waste, our resources: a strategy for England
- ENDS Report (2021), Mapped: The UK’s plastic waste exports
- Department for Environment, Food and Rural Affairs (2021), September 2021: Waste and resource efficiency factsheet (part 3)
- European Union (2019), COMMISSION DELEGATED REGULATION (EU) 2020/2174
Status: Completed
Second National Infrastructure Assessment: Baseline Report
An analysis of the current state of key infrastructure sectors
Reports & StudiesDesign & Funding Digital & Data Energy & Net Zero Environment National Infrastructure Assessment Place Regulation & Resilience Transport Water & Floods
Latest Updates

Coming up in 2024
This page shows a calendar reflecting the latest expected dates for Commission reports, publications and events. You can also sign up to receive our quarterly newsletter by entering your email address in the box at the foot of each website page.