Historic Water Dataset
Updated:
Selected data on Britain's water sector spanning back as far as 1961
Published: Tagged: Water & Floods
Summary
The Commission has curated a historical water and wastewater dataset to help build a more comprehensive picture of the UK's water industry and identify trends.
The Commission asked ICS Consultants, with the help of Professor John W. Sawkins of Herriot-Watt University and Professor David S. Saal of Loughborough University, to collate water and wastewater statistics from before a time where records were digitised. The resulting statistics from the pre-privatisation era are presented here and are available for all to download.
The data presented is up to date at the time of publication. Both Ofwat and DiscoverWater publish regular updates to this data.
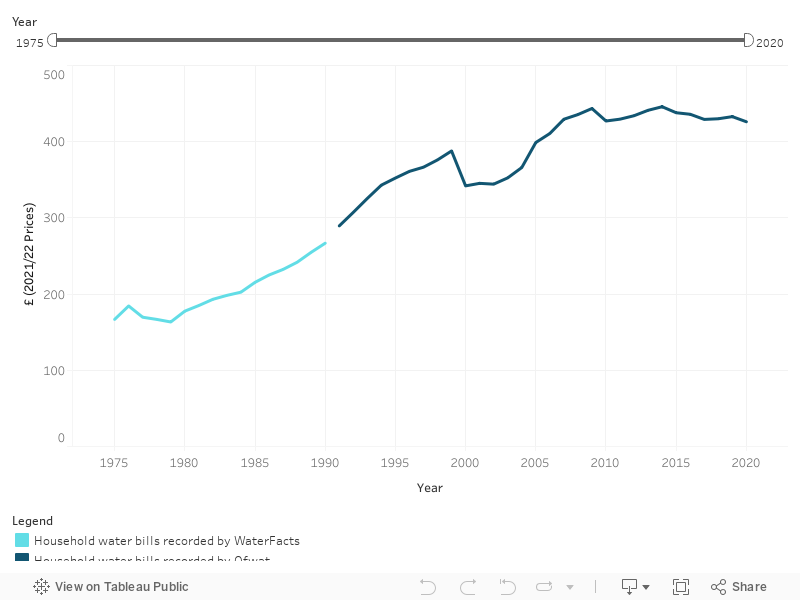
Water bills
Data showing the change in average household bills for water and sewerage services in real terms. The data series combines data from WaterFacts and Ofwat to provide a fuller picture of how water bills have changed between 1975 and 2021.
Water bills for England and Wales
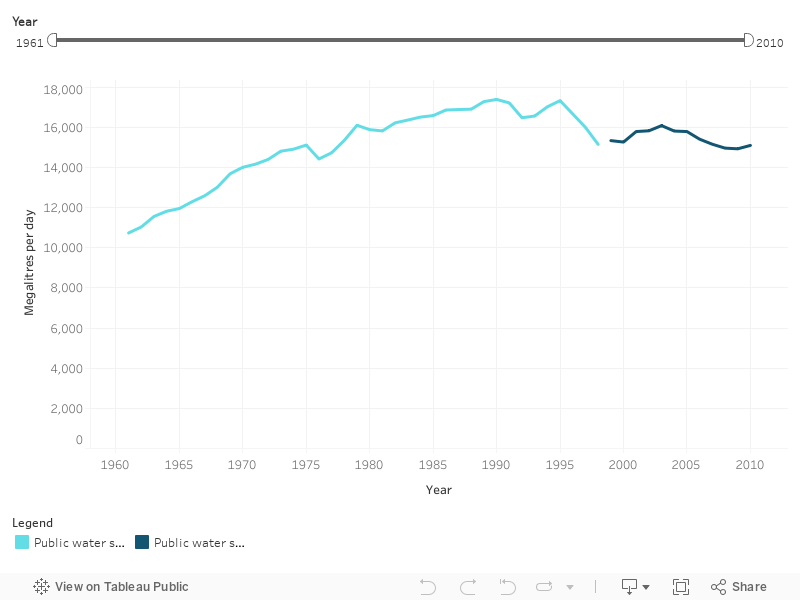
Public water supplied
Data showing total water supplied (metered and unmetered) for England and Wales between 1961 and 2010.
Public water supplied
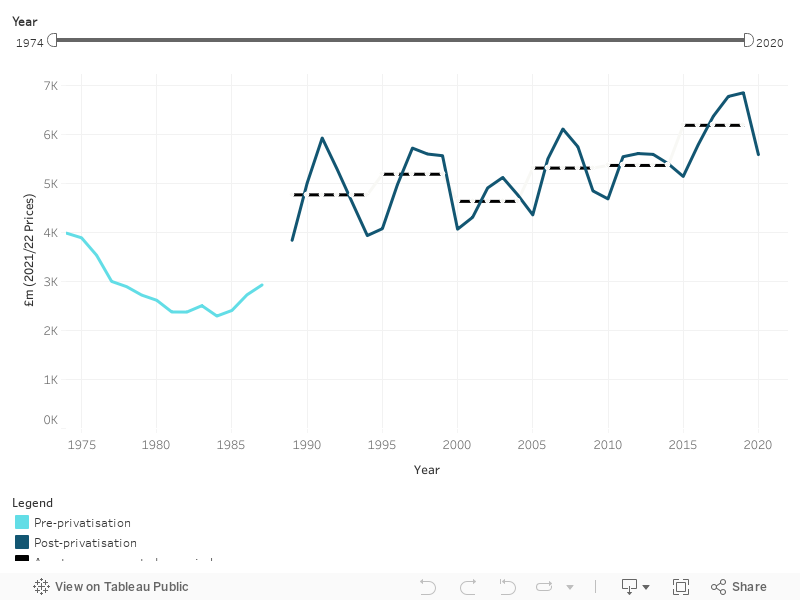
Capital expenditure
Gross capital expenditure by the water industry across England and Wales between 1974 and 2021. Regional Water Authorities were first established in 1974 so this is the earliest that data is available. The chart shows both annual gross capital expenditure and, since privatisation, average gross capital expenditure over the five years between each price review (the ‘asset management plan' or AMP period). Gross capital expenditure in every AMP period has been significantly higher than at any point under Regional Water Authorities.
Capital expenditure by the water industry in England and Wales
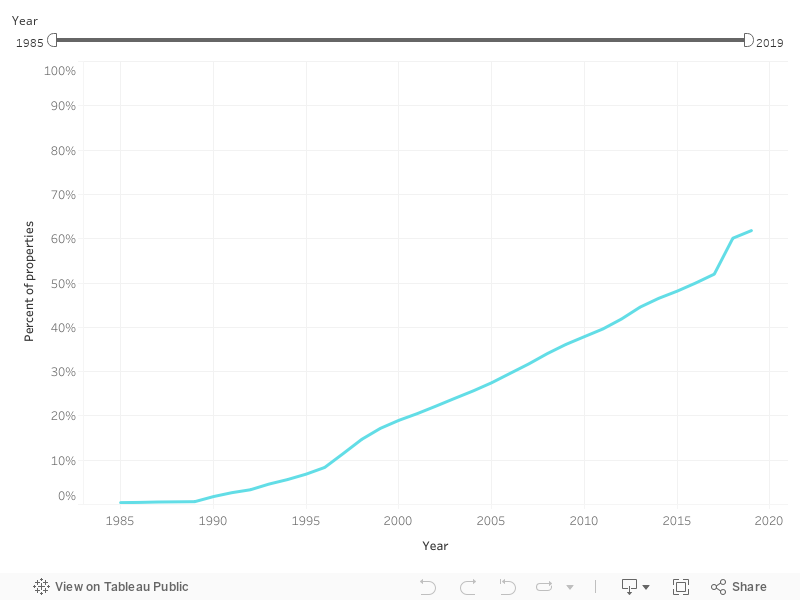
Water meter installations
Data showing the percentage of properties with water meters installed in England over time. The proportion of households with water meters installed has risen steadily over the past three decades.
Percentage of properties with water meters installed in England