Baseline Report Annex F: Transport
Analysis of the country's transport infrastructure which informs the Baseline Report for the second National Infrastructure Assessment.
Tagged: Transport
Sector overview
Transport infrastructure connects people, communities, and businesses, and is essential to economic growth, productivity and quality of life. Its functions include moving people and goods between different places.
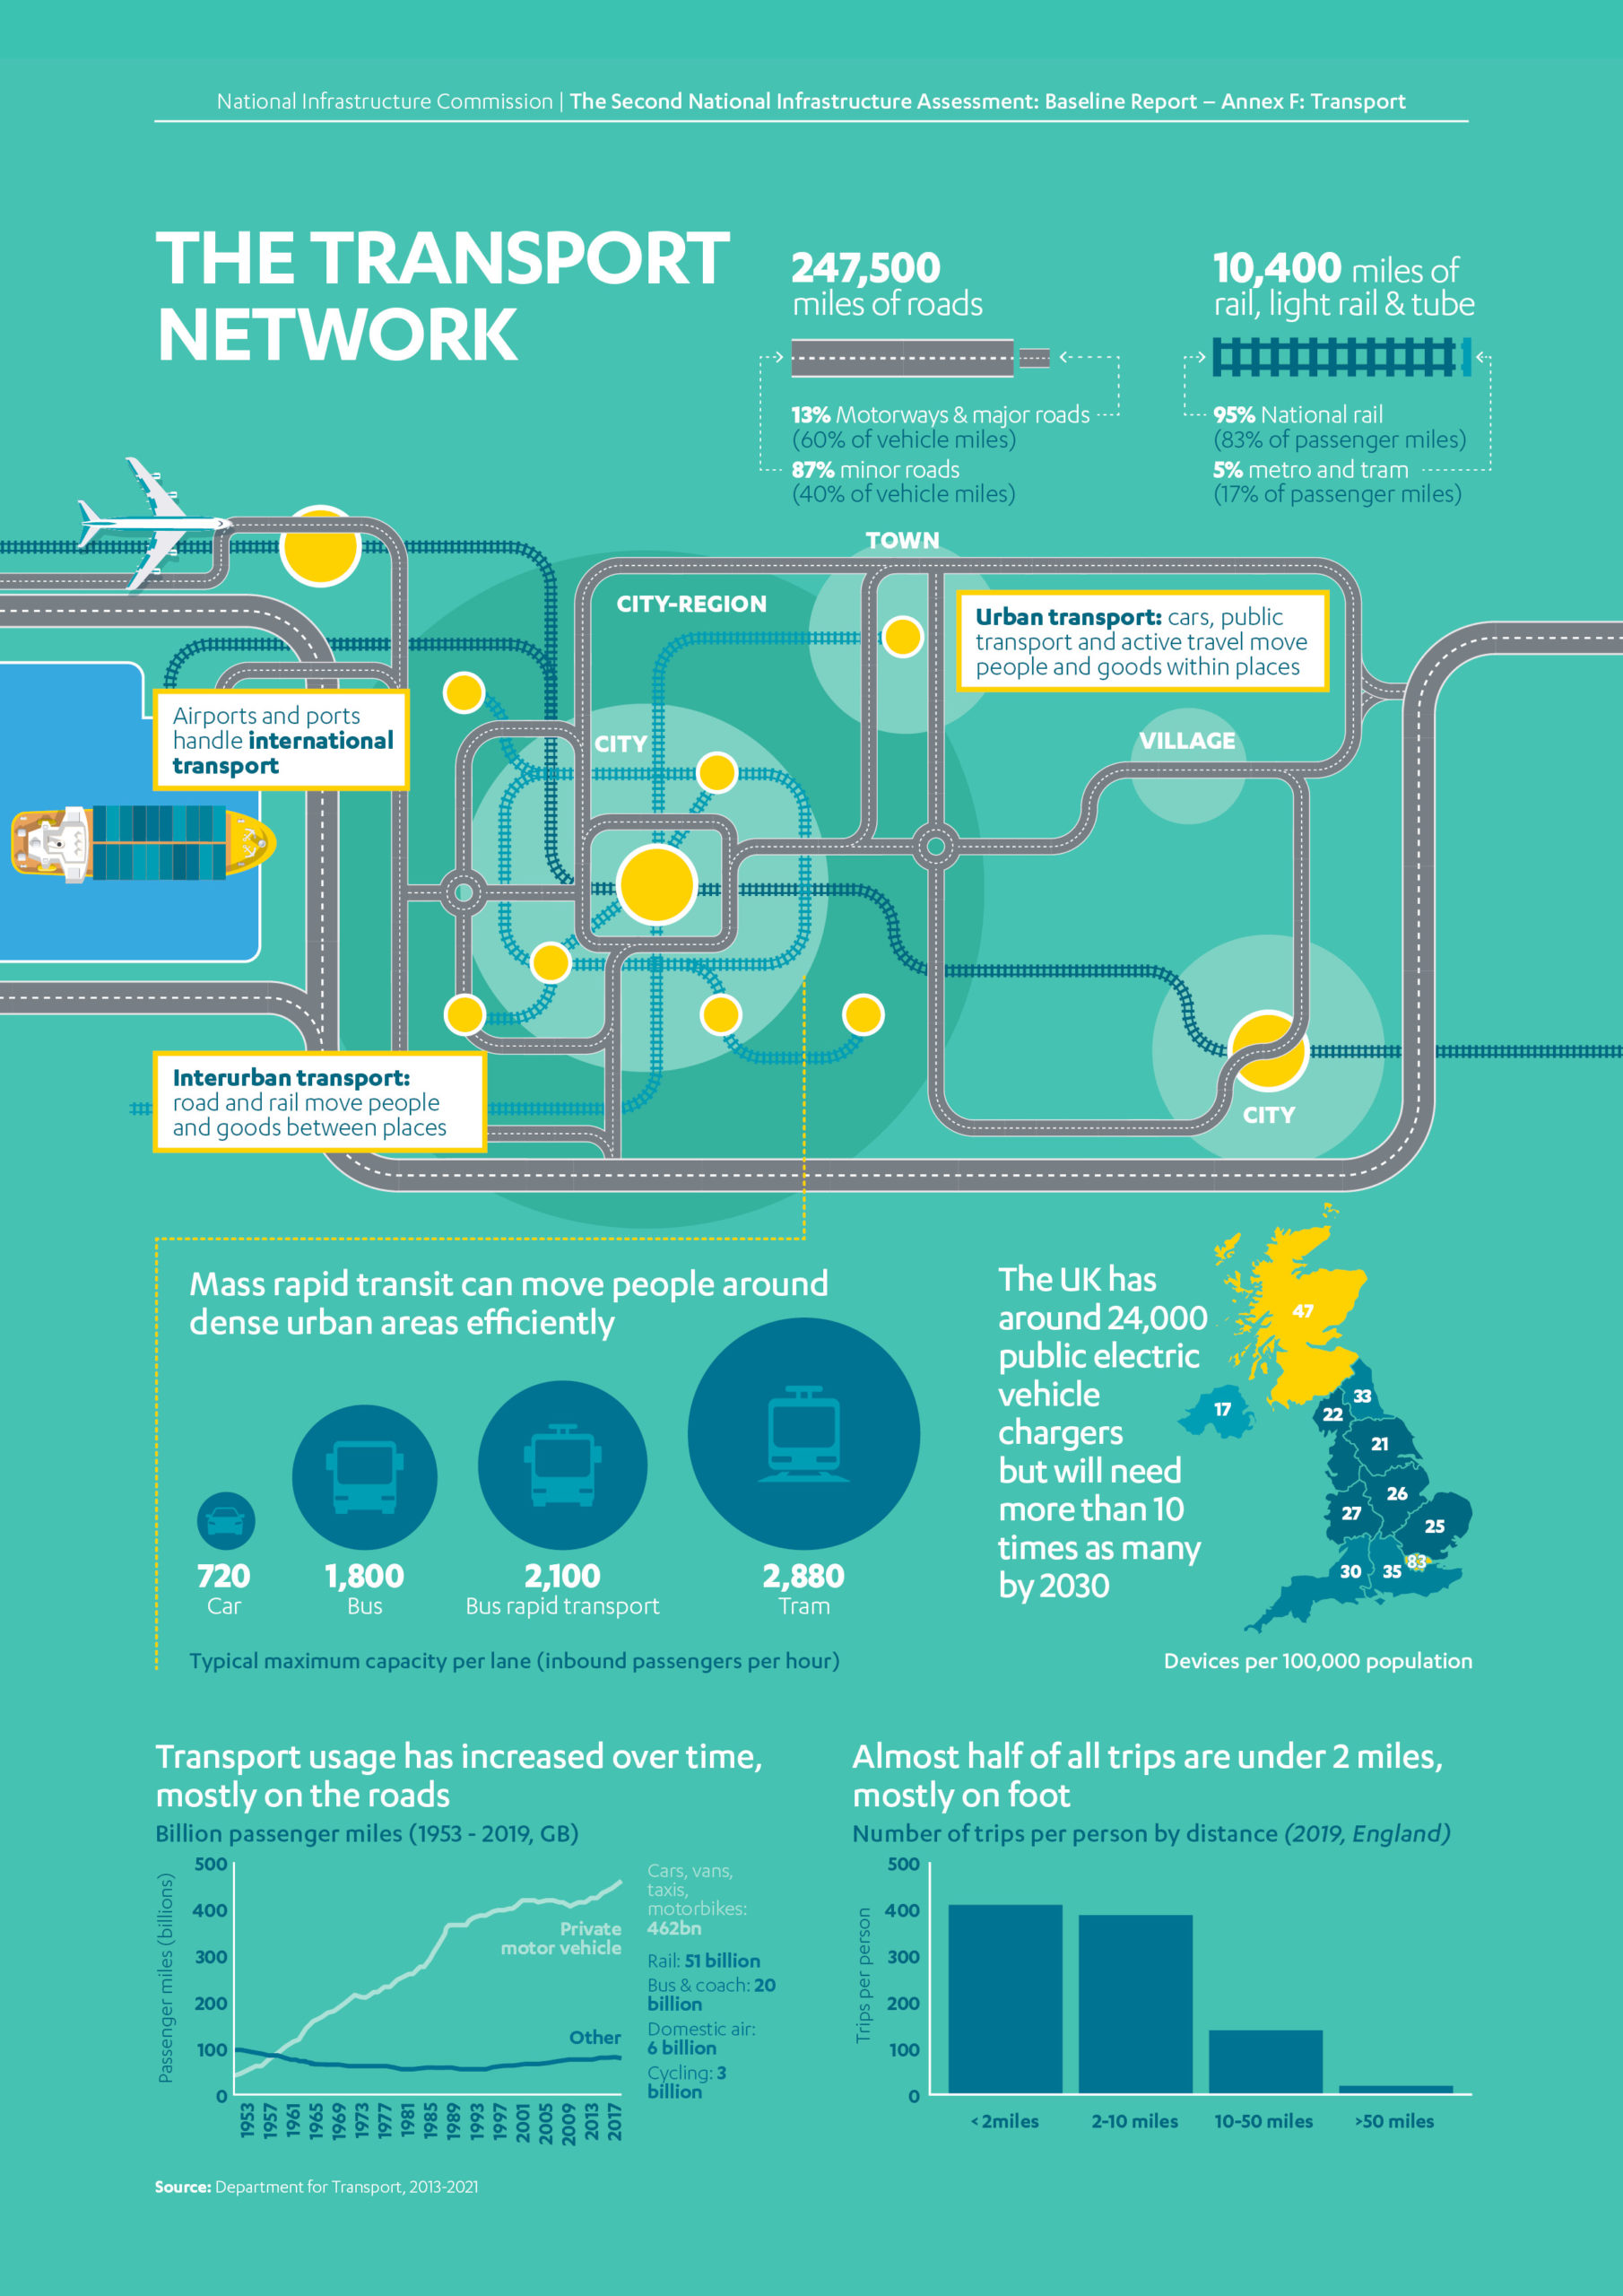
Transport mode share varies according to the length of the trip. Journeys of less than two miles are most likely to be made by walking or cycling (61 per cent of trips), with 35 per cent of trips being made by car. Journeys between two and 25 miles are mostly made by car (80 per cent of trips), with 13 per cent made by public transport (bus, light rail and rail). Longer distance trips of over 25 miles are mostly made by car (79 per cent) and by train (16 per cent).1
Mode also varies by the purpose of the trip. Car remains the dominant mode regardless of purpose with 58 per cent of all trips. However some modes are used much more for some purposes than they are for others. For example 21 per cent of commuting trips are made by public transport compared to nine per cent of trips overall. Walking made up 41 per cent of trips to education compare to 26 per cent of trips in total. Road is dominant for freight, with rail and water also carrying a significant share.2
Transport infrastructure includes the roads and rail used by transport, stations used by passengers to access the network, fueling infrastructure like electric vehicle charging points, and ports and airports. Across Great Britain, road is by far the biggest component of the network with 247,500 miles of roads compared to 10,400 miles of rail (including light rail).3 Surface transport by road (including footways) and rail represents more than 99 per cent of domestic travel, both by number of trips taken and total mileage.4
In 2019, there were 542 billion passenger miles across all modes of transport, up 11 per cent over a decade.5 In addition, 122 billion tonne miles of domestic freight was moved within Great Britain.6
The Covid 19 pandemic has changed travel behaviours dramatically and it is unclear the extent to which transport patterns will revert to previous trends or whether changes in behaviour will be permanent. The Commission has considered how this uncertainty can be reflected in policy making, and some of the different scenarios that policy may need to plan for, in Behaviour Change and Infrastructure Beyond Covid-19.7
Transport infrastructure is capital intensive but tends to have a long lifetime. The total value of road infrastructure in Great Britain is estimated to be £227 billion. Great Britain’s rail network is estimated to be worth £336 billion.8 Asset life varies considerably with well used parts of the network being replaced much more frequently than peripheral connections such as rural roads.
The transport sector is the biggest single contributor to UK carbon emissions as well as emitting other harmful airborne pollutants like nitrogen oxides and particulate matter.9
Transport and the Commission’s remit
The Commission’s remit covers the economic infrastructure on which transport depends, including road and rail networks for passengers and freight, electric vehicle charging networks, public and active transport networks, ports and airports. However, patterns of transport use determine the demand for this infrastructure, and so the Commission (and this annex) also considers patterns of use of transport such as cars, vans and rail, where this is relevant to infrastructure.
The Commission covers economic infrastructure within the UK Government’s competence. Road and rail transport policy are largely devolved in Scotland and completely devolved in Northern Ireland. Road transport is also largely devolved in Wales, but rail policy is largely reserved. Maritime and aviation are largely reserved. In keeping with the second Assessment’s focus on road and rail, the Commission’s focus in this annex is primarily on transport in England.
Box F.1: History of transport and the urban economy
There is a two way relationship between transport and the urban economy, with each influencing the shape and form of the other. The density of urban centres reflects the benefit of firms locating close to each other.10 Transport infrastructure has a lifespan of several decades and it shapes the location of homes, businesses, and public services.11
In the early twentieth century, motor vehicles became more widespread, and there was a shift to private transport, leading to the closure of many local tramways. From the 1950s onwards, road traffic grew rapidly, and the government started developing the national motorway network. The first section opened in 1958. Private railway companies were nationalised in the 1940s but rail use fell as cars grew in popularity. During the 1950s almost all remaining local tramways closed, cycling fell rapidly, and bus use began a steady decline.12
In the 1960s, rising levels of car ownership began to influence urban design. New developments were planned to accommodate a car owning middle class, and towns and cities spread along new arterial roads.13 Rail use continued to decline, and by 1971 43 per cent of the former rail network by mileage was permanently closed.14
During the 1970s and 1980s new housing estates and out of town shopping centres were predicated on high levels of car ownership. Congestion worsened, particularly in large cities, and new peripheral ring roads were built which stimulated additional car based development. The decline in railway use started to slow, however investment remained low, with government investment focused on expanding road capacity.
In the 1990s, shifts in the structure of the economy supported urban regeneration and densification.15 The population of inner London began to rise again,16 and rail journeys increased.17 British Rail was split into multiple businesses and privatised, and new light rail networks were built in Manchester, Sheffield, and Birmingham.
From 2000 to the present day, many cities experienced population and economic growth. The rapid growth in car journeys started to level off. Rail infrastructure was brought back into public ownership following a series of accidents due to the poor state of the network, with government investing to improve safety and capacity. Rail journeys quickly rose, and light rail networks were expanded in core cities. Per person car use started to decline, due to a combination of demographic and economic change, social shifts in working and shopping, the impact of policies to encourage urbanisation, and advancements in technology.18
However, England’s transport system remains predominantly and significantly car based.19
Next Section: Governance and regulation
Although transport networks interact as a system at different spatial levels, the transport sector is largely owned and managed according to transport mode (i.e. road, rail etc).
Governance and regulation
Although transport networks interact as a system at different spatial levels, the transport sector is largely owned and managed according to transport mode (i.e. road, rail etc).
For the majority of the sector, privately owned vehicles and services run on publicly owned networks. In England, the Department for Transport is responsible for transport legislation and policy, with the Office of Road and Rail as the regulator for economic and safety issues for surface transport. The Civil Aviation Agency is the regulator for aviation across the UK. Local government and other subnational bodies also play an important role.20
Roads are primarily used by privately owned cars, with safety and ownership regulated by the Driver and Vehicle Standards Agency and the Driver and Vehicle Licensing Agency.21 Government is responsible for setting environmental standards and delivering policy relating to decarbonisation of vehicles, particularly through the Office for Zero Emission Vehicles. Ofgem, the economic regulator for the electricity and gas markets, regulates electric vehicle charging infrastructure.22
Local networks
All areas of England are covered by a highway authority. This will be the county council, unitary authority or metropolitan borough council that covers the area in question. Local highway authorities manage local roads, which consists of all A roads, B roads, C roads and unclassified roads other than those managed by National Highways. The local highways network also includes management of the footway and other paths for walking and cycle paths where these exist separately from the road.23
Local bus networks are run by the private sector. Local transport authorities are required to ensure that their local passenger transport meets local needs. Most meet this requirement by subsidising bus routes that they judge to be socially necessary, but which would not otherwise be profitable.24
Councils also have the power to introduce congestion charging schemes. The only congestion charging schemes in operation are in London, run by Transport for London, and in Durham, run by Durham County Council. Nottingham City Council have introduced a work place parking levy which charges businesses an annual levy for every parking space they provide in order to reduce the number of cars in the city centre.25
City Region
Larger cities have additional governance mechanisms, reflecting their need for mass transit systems. Passenger transport executives are responsible for local transport policy and public transport services in some city regions outside London. Additional transport powers have also been devolved through bespoke deals with the nine mayoral combined authorities and the North East Combined Authority, some of which have absorbed or replaced the role of previous passenger transport executives, and have political oversight through the metro mayors.26 Similar powers have also been devolved to the Cornwall Unitary Authority.
However, there is no consistent governance picture across cities and governance arrangements reflect the process of devolution deals made over the last decade. Moreover, mass transit does not necessarily follow devolution to a mayoral authority – Nottingham has a tram system but no mayor, whereas West Yorkshire has a mayor but no system of mass transit within its boundaries.27
London
The London transport system is governed by different legislation to the rest of England. Transport for London is an integrated transport authority that runs all public transport within London, and a limited number of services operating outside of London which serve London commuters. Transport for London is overseen by a board appointed by the Mayor of London. The m,ayor has policy responsibility for public transport within London and sets fare levels. London boroughs serve as highway authorities except for a network of the most significant roads which are run by Transport for London.28
National networks
England’s national surface transport networks are outside of local government control, and run by national government agencies or the private sector.29
National Highways
The national road network, also known as the strategic road network, covers nearly all motorways and some major ‘A’ roads. It is owned, operated, and managed by National Highways (formerly Highways England) a government owned company established in 2015.30
Network Rail
National rail tracks, structures, signalling, and the twenty biggest stations are owned and operated by Network Rail, a government owned company. It is responsible for operating, renewing, maintaining and enhancing rail infrastructure, and coordinating timetables. Delivery of the largest rail projects, including High Speed 2 and Crossrail, is managed by specially established public companies.31
Train operating companies
Most passenger services are run by train operating companies through a franchising model managed by government, with contracts retendered approximately every seven years. Government provides significant ongoing subsidy and is obliged to take direct control of services if franchise arrangements are not met. Freight operators, and several unfranchised passenger services, operate on a commercial basis, buying rail access from Network Rail. Rolling stock companies own and lease trains to train and freight operators.32
The franchising model was suspended during the Covid 19 pandemic and is being replaced permanently with a concession style model. This change will mean that train operating companies can bid to run a service specified by the contracting body, Great British Railways. They will then be paid a fee to deliver the service rather than relying on fare revenue. This model will result in a transfer of risk from private operators to the new publicly owned contracting body.33
Subnational transport bodies
Subnational transport bodies cover almost the entirety of England to develop regional strategies and advise the government on how to best direct national transport investments. Their size varies as they are constituted by local authorities that mutually agree to their formation and share responsibility for their administration.34 For example Transport for the North covers 56 local authorities and 15 million people.35 Whereas Peninsula transport was formed by five local authorities with a combined population of 2.3 million people.36
Freight
The freight system predominantly operates within the private sector, with little intervention from government beyond the provision of road and rail.37 As recommended by the Commission, the government has established a cross modal freight forum and is developing a cross modal freight strategy, expected late 2021. At present, road freight is part of National Highways’ long term planning process , while rail freight is informed by the government’s 2016 Rail Freight Strategy and Network Rail’s 2017 Rail Freight Network Study.38 Some cities and transport corridors also have dedicated freight strategies,39 and local transport planning includes freight.
International networks
Links to international transport networks come through ports and airports which are run by the private sector. England’s sole rail link to international networks, the Channel Tunnel, is also owned and operated by a private company.40
Ports
Most English ports are private enterprises and are responsible for their own development and investment.41 Local authorities act as the planning authority for ports in their area. The Department for Transport has overall responsibility for maritime policy across the UK, while the Canal & River Trust is responsible for navigable rivers and canals in England and Wales.42
Airports
Responsibility for governance, legislation and policy sits with the Department for Transport. The Civil Aviation Authority regulates consumer protection and the safety and security of aviation.43 Air traffic control for UK airspace is provided mainly by NATS holdings, a formerly public body which was largely privatised in 2001, and by local airport control teams.44 England has 26 commercial airports.45 Following the privatisation of the publicly owned company British Airports Authority which ran UK airports until 1987, most airports are owned by private sector investors, local government, or a combination of the two.46
Funding and financing
Funding
Given the focus of the Commission’s work in the second Assessment, this section focuses on surface transport.
Road
Funding for roads refers to the spending that allows the network to continue to function day to day. This means money spent on maintaining and operating the existing network and the vehicles that run on the network.47
As the road network is free at the point of use (except for some toll roads and bridges), roads are publicly funded primarily by revenues from taxation levied by central government. Funding for national roads is distributed to National Highways from central government. Local authorities fund local roads and public transport through grants from central government, council tax, user charges (such as parking revenue, toll roads and congestion charges) and planning system charges such as levies on new development.48
The use of road vehicles is directly taxed through vehicle excise duty (an annual tax on a vehicle) which in 2019-20 raised £6.8 billion and fuel duty (a tax on fuel purchases) which in 2019-20 raised £28 billion.49 Vehicle excise duty is ringfenced for spending on roads, but fuel duty forms part of the government’s general tax incomes.
The running costs of road vehicles are privately funded by households and businesses in the form of fuel, maintenance, motoring taxes and insurance costs.
Buses are funded through a combination of direct and indirect public subsidies and fares.50
Rail
Funding for maintaining the rail network and running services is primarily met through a combination of user charges and taxation. User charges consist of revenue from fares and season tickets collected by train operating companies. As these do not cover the full costs of rail, government uses tax revenues to provide subsidy to the industry. Subsidies take the form of payments to train operating companies, grants to Network Rail and, prior to 2019-20, loans for enhancement of the existing network. Network Rail and train operating companies also fund rail through freight customers, property and concessions.51
Trends in funding
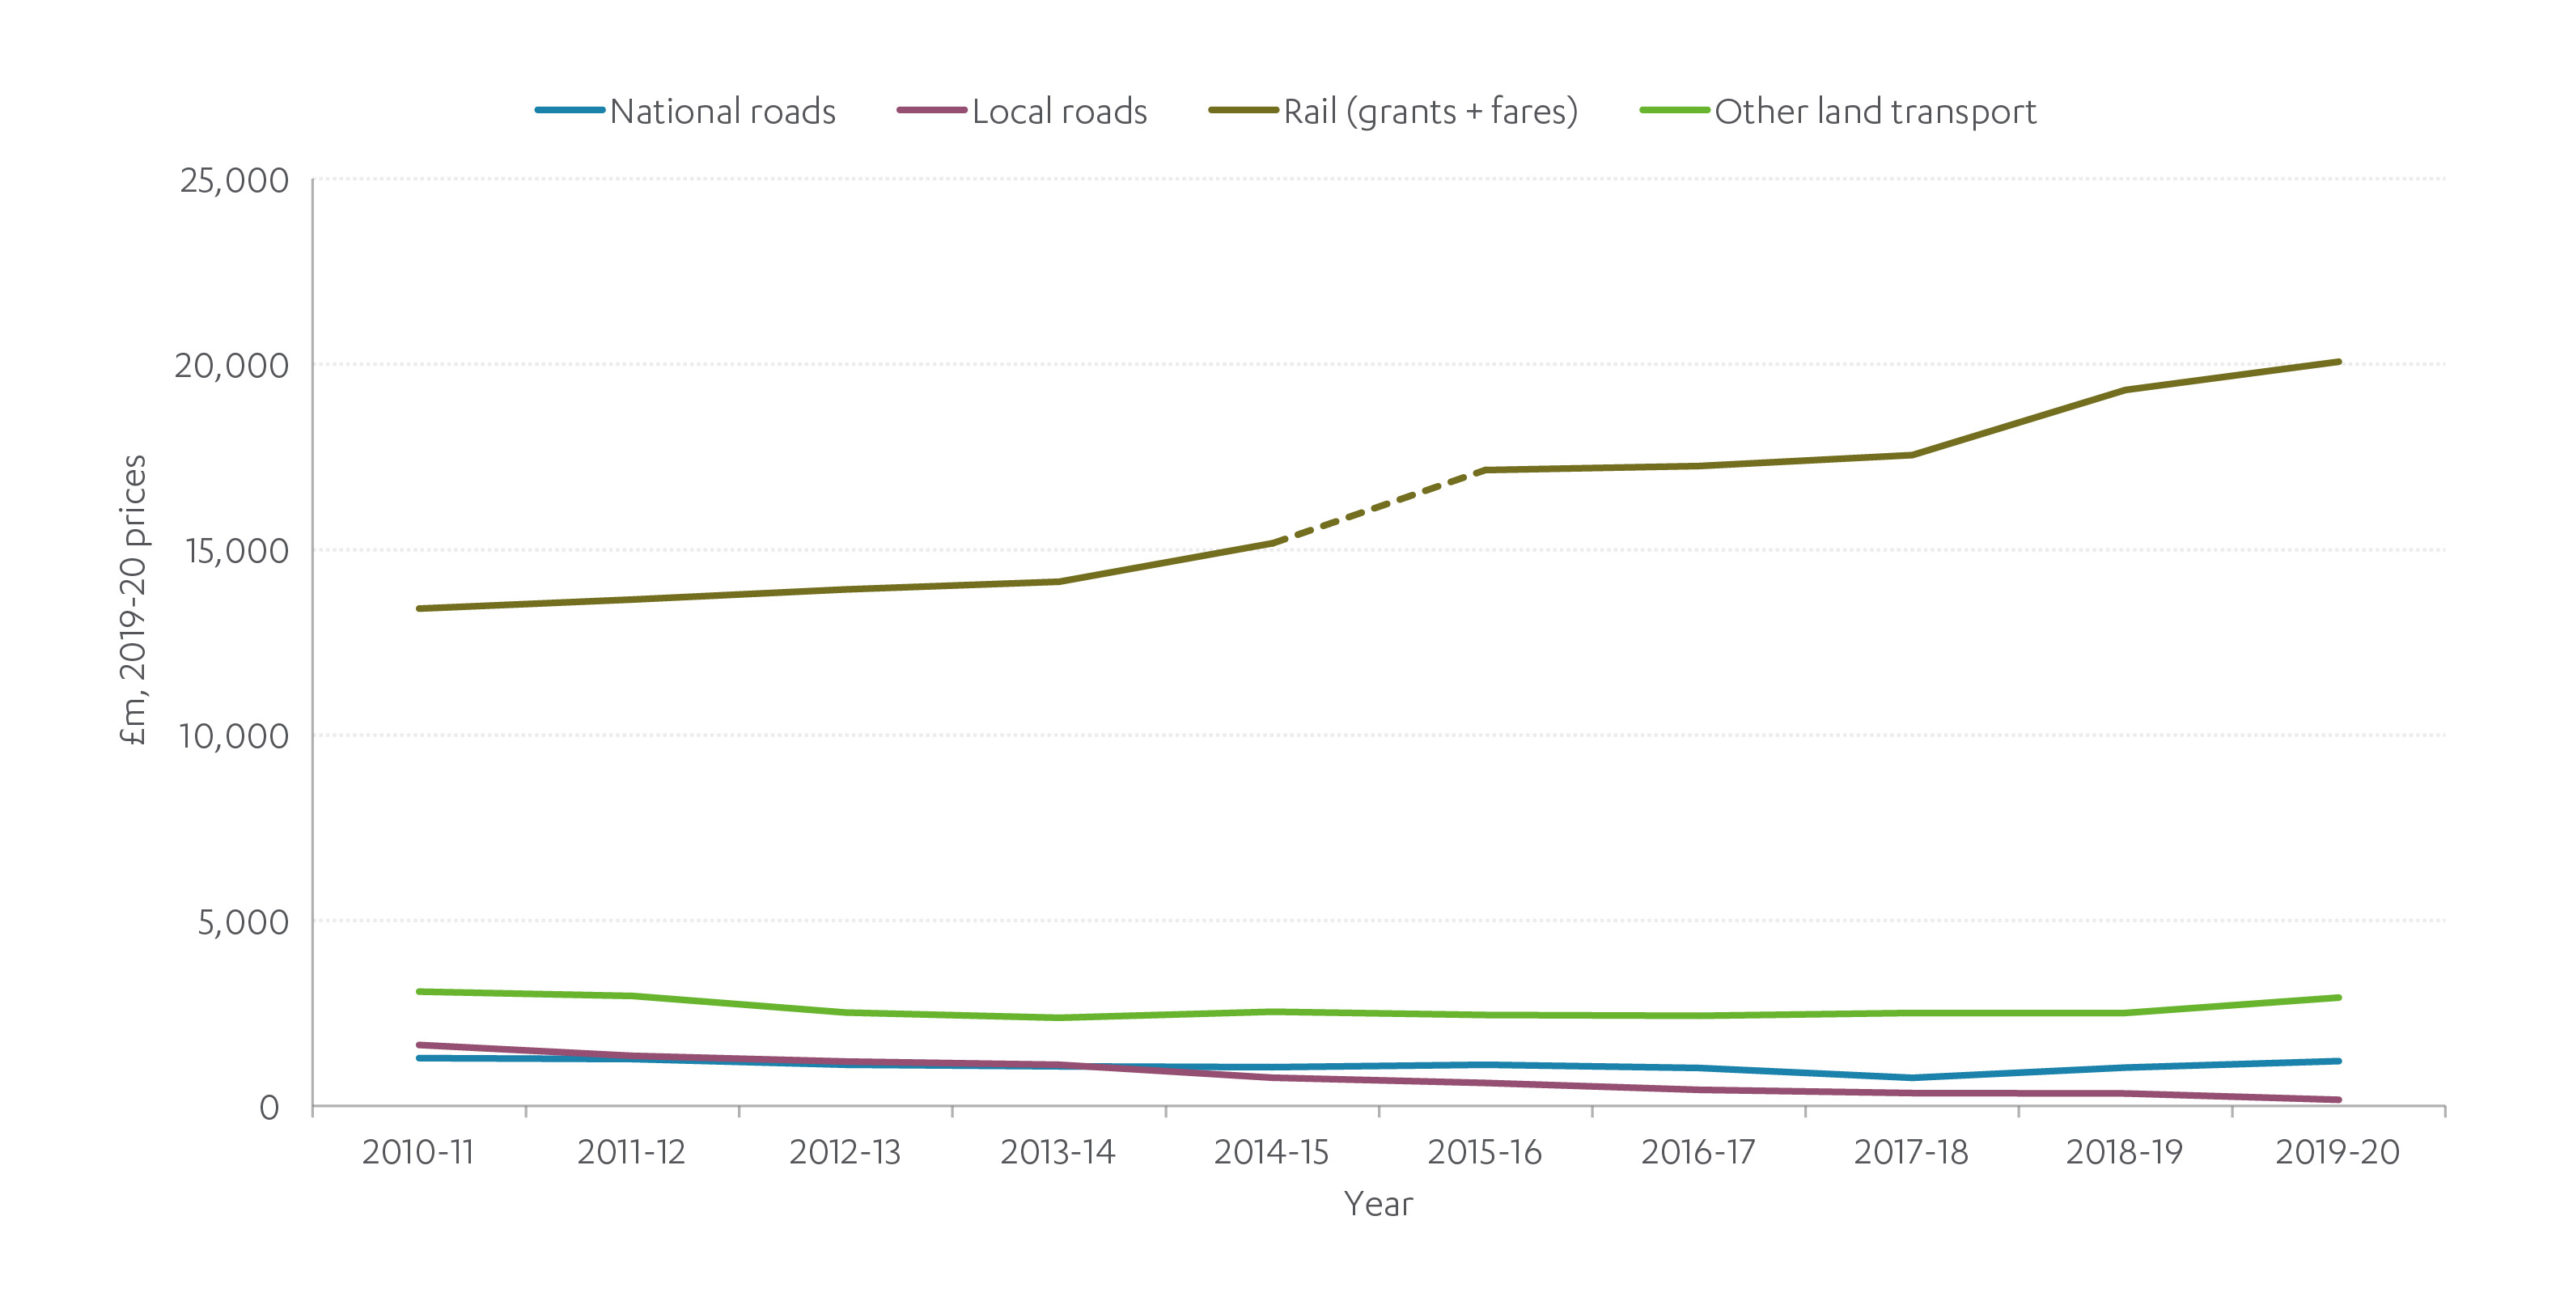
Figure F.1: Funding for transport services has remained stable in real terms over the past 15 years
Operational funding for transport services (includes fuel duty but excludes motor vehicle insurance, vehicle excise duty, and business motoring costs)

Source: Department For Transport (2020), Rail Finance ; Department For Transport (2020) Transport Expenditure
Figure F.2: Local roads funding has declined whilst national road funding has grown over the past decade
Operational funding for transport services (excluding all motoring costs)
Source: Department For Transport (2020), Rail Finance ; Department For Transport (2020), Transport Expenditure
The transport sector receives far more funding from private users than from the public sector. However, the majority of this comes in the form of household expenditure on using and maintaining cars. Funding from households remains flat with the use of larger vehicles offset by greater vehicle efficiency and a decline in mileage. Government funding for local roads has been declining in real terms since 2010 in contrast to expenditure on national roads which has increased since the formation of National Highways (then Highways England) in 2015.52
Funding for rail has increased over the last decade driven by growth in rail passenger numbers.53
During the Covid 19 pandemic passenger numbers on public transport collapsed during national lockdowns with government advising essential workers to avoid public transport where possible.54 In order to avoid the collapse of public transport providers the government gave emergency support to the rail, bus and light rail industries of around £7 billion to ensure a reduced core service was able to run.55
Financing
Transport capital costs are dominated by private expenditure on new road vehicles (both passenger and freight) by households and businesses. The upgrade of the physical infrastructure on transport networks is mainly financed by public investment. For roads (local and national), this covers construction of new roads to expand the network, extending the life of the network and enhancement of existing infrastructure.56
In rail, public financing supports investment for expanding and extending the life of the national rail network, either via Network Rail for capacity upgrades to existing routes or sometimes to public corporations for new routes.57
For local rail, this includes public financing to invest in expanding and enhancing light rail and tram networks. Investment in the national road and rail networks delivered by Network Rail and National Highways is monitored by the Office for Road and Rail, ensuring that they deliver planned investment and meet other performance commitments.58
In rail, private financing by rolling stock leasing companies delivers new rolling stock which is then leased to train operating companies. Private finance initiative contracts have supported road and highways maintenance investment by National Highways and some local authorities and the construction of the proposed Silvertown tunnel in London.59
Figure F.3: Investment in private vehicles has risen in the last fifteen years
Investment in transport services
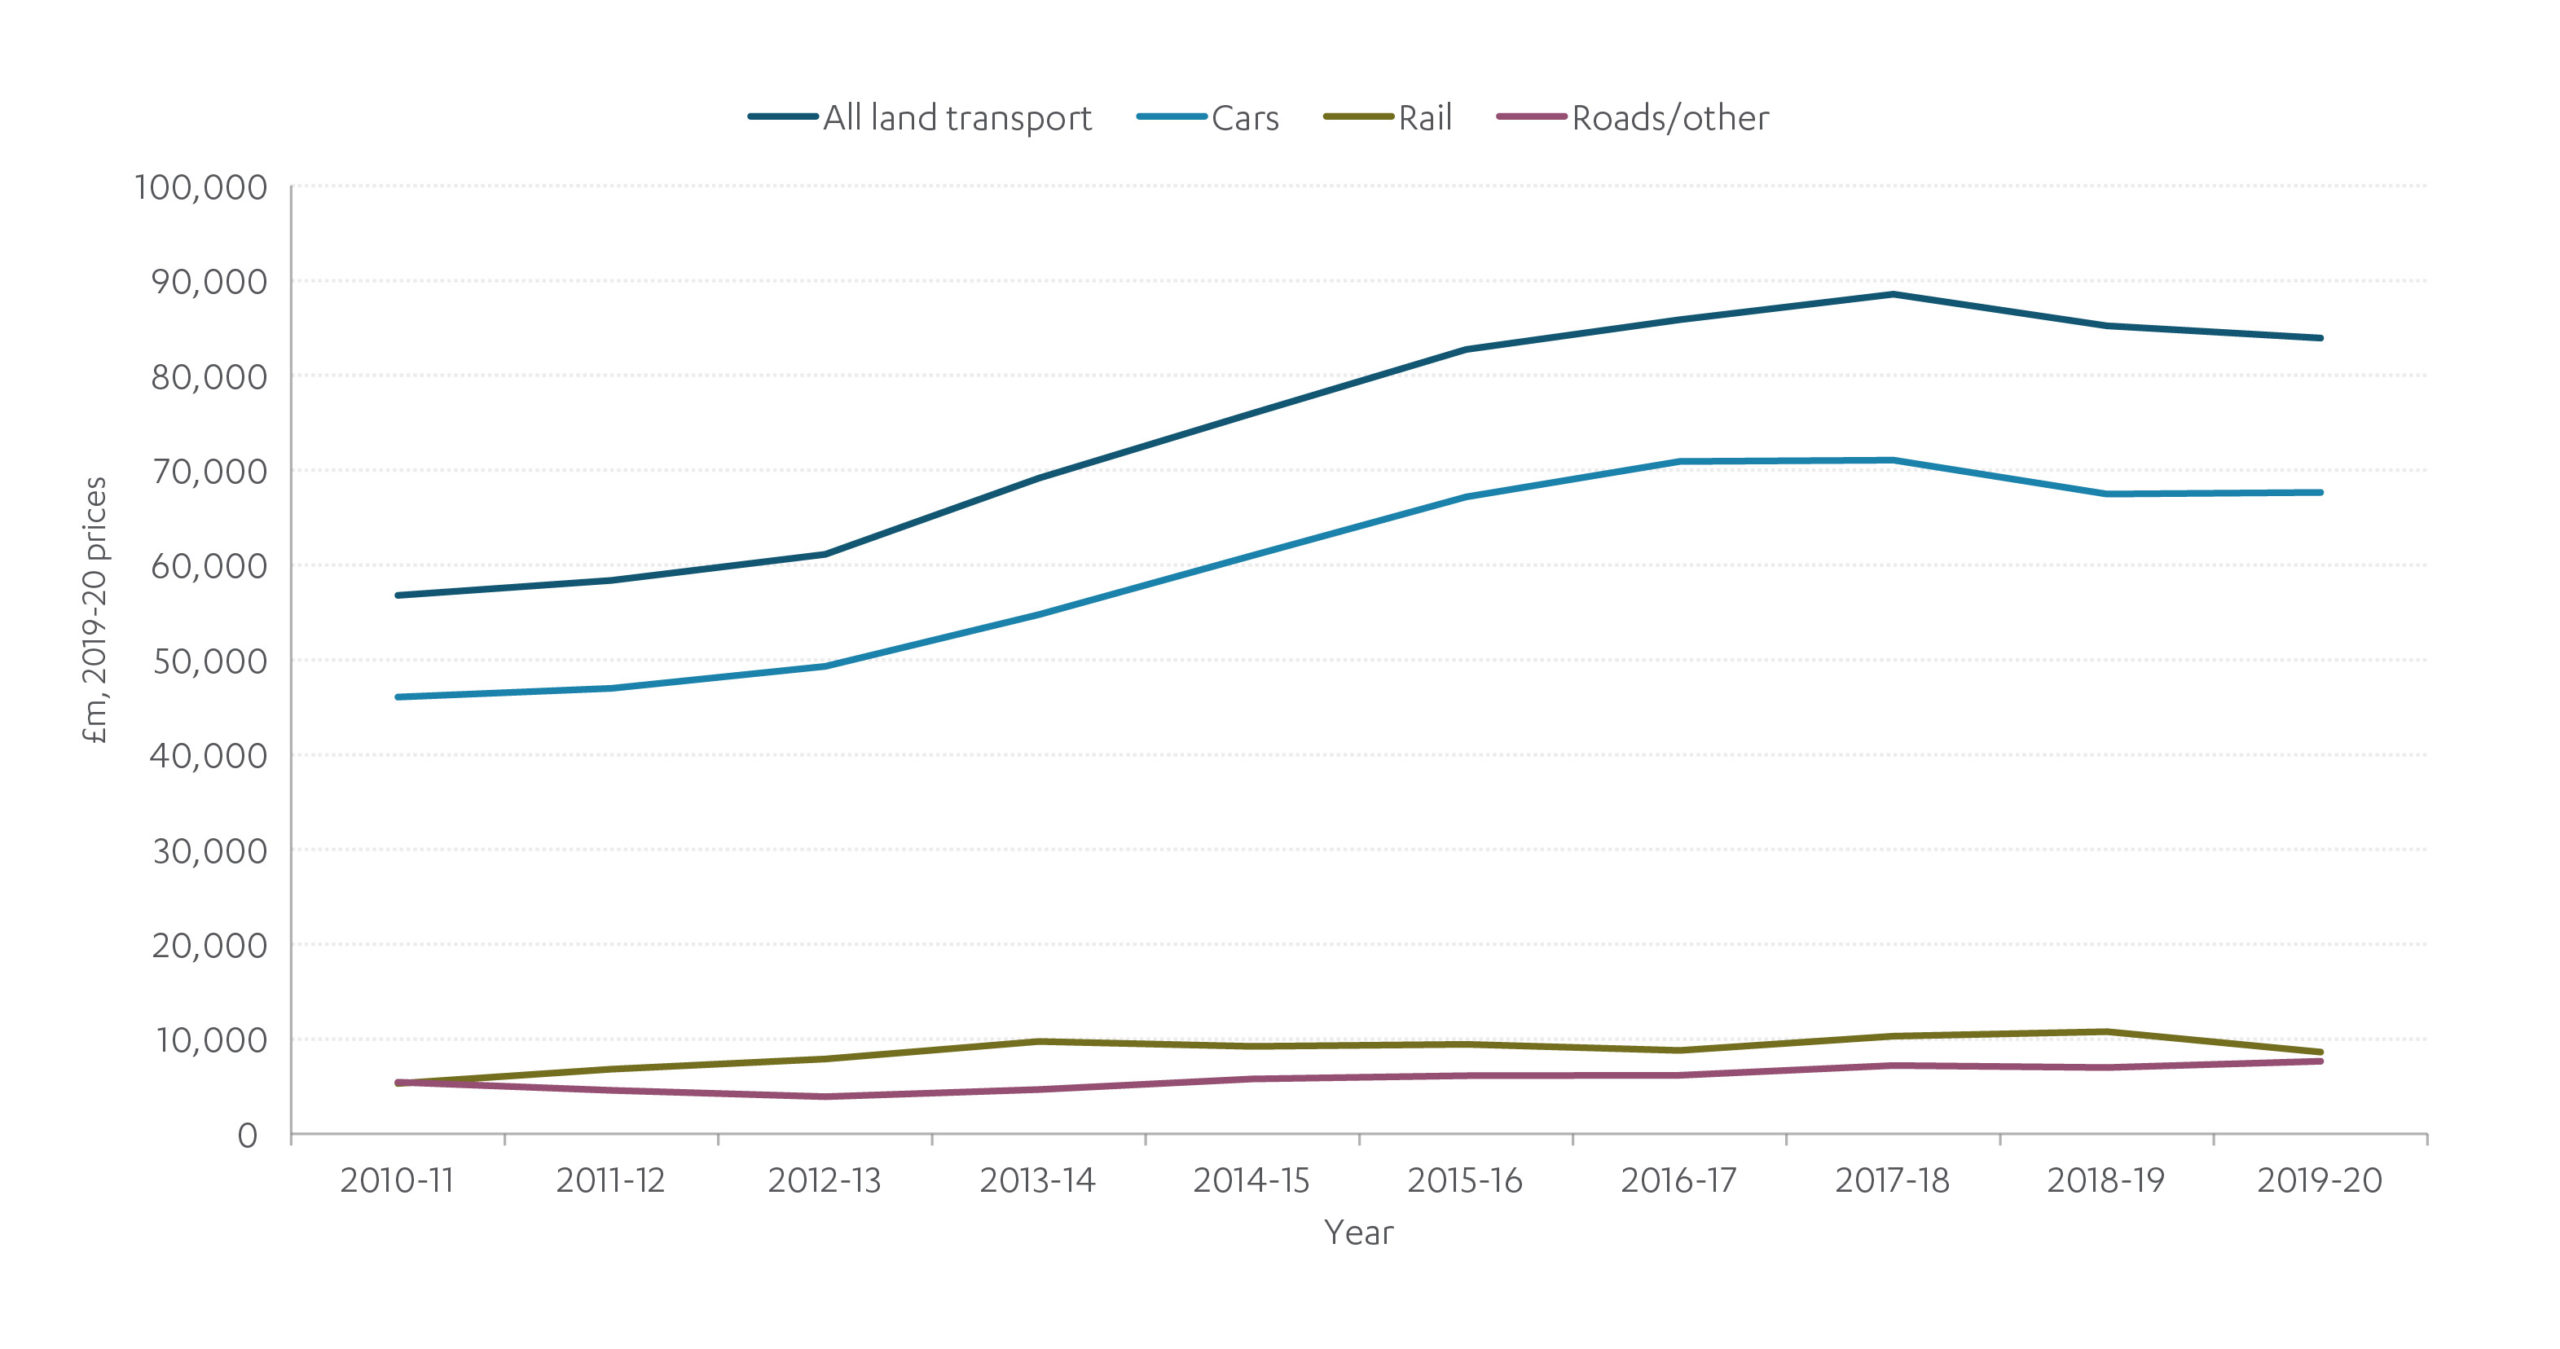
Source: Office for Road and Rail (2020), Private sector investment in the rail industry; Network Rail (2020), Network Rail annual report and accounts; Department for Transport (2020), Transport expenditure; International Council of Clean Transportation (2021), European Vehicle Market Statistics; NIC calculations
Figure F.4: Public investment in transport has risen significantly in the last decade, particularly for rail and national roads
Investment in transport services (excluding motoring)
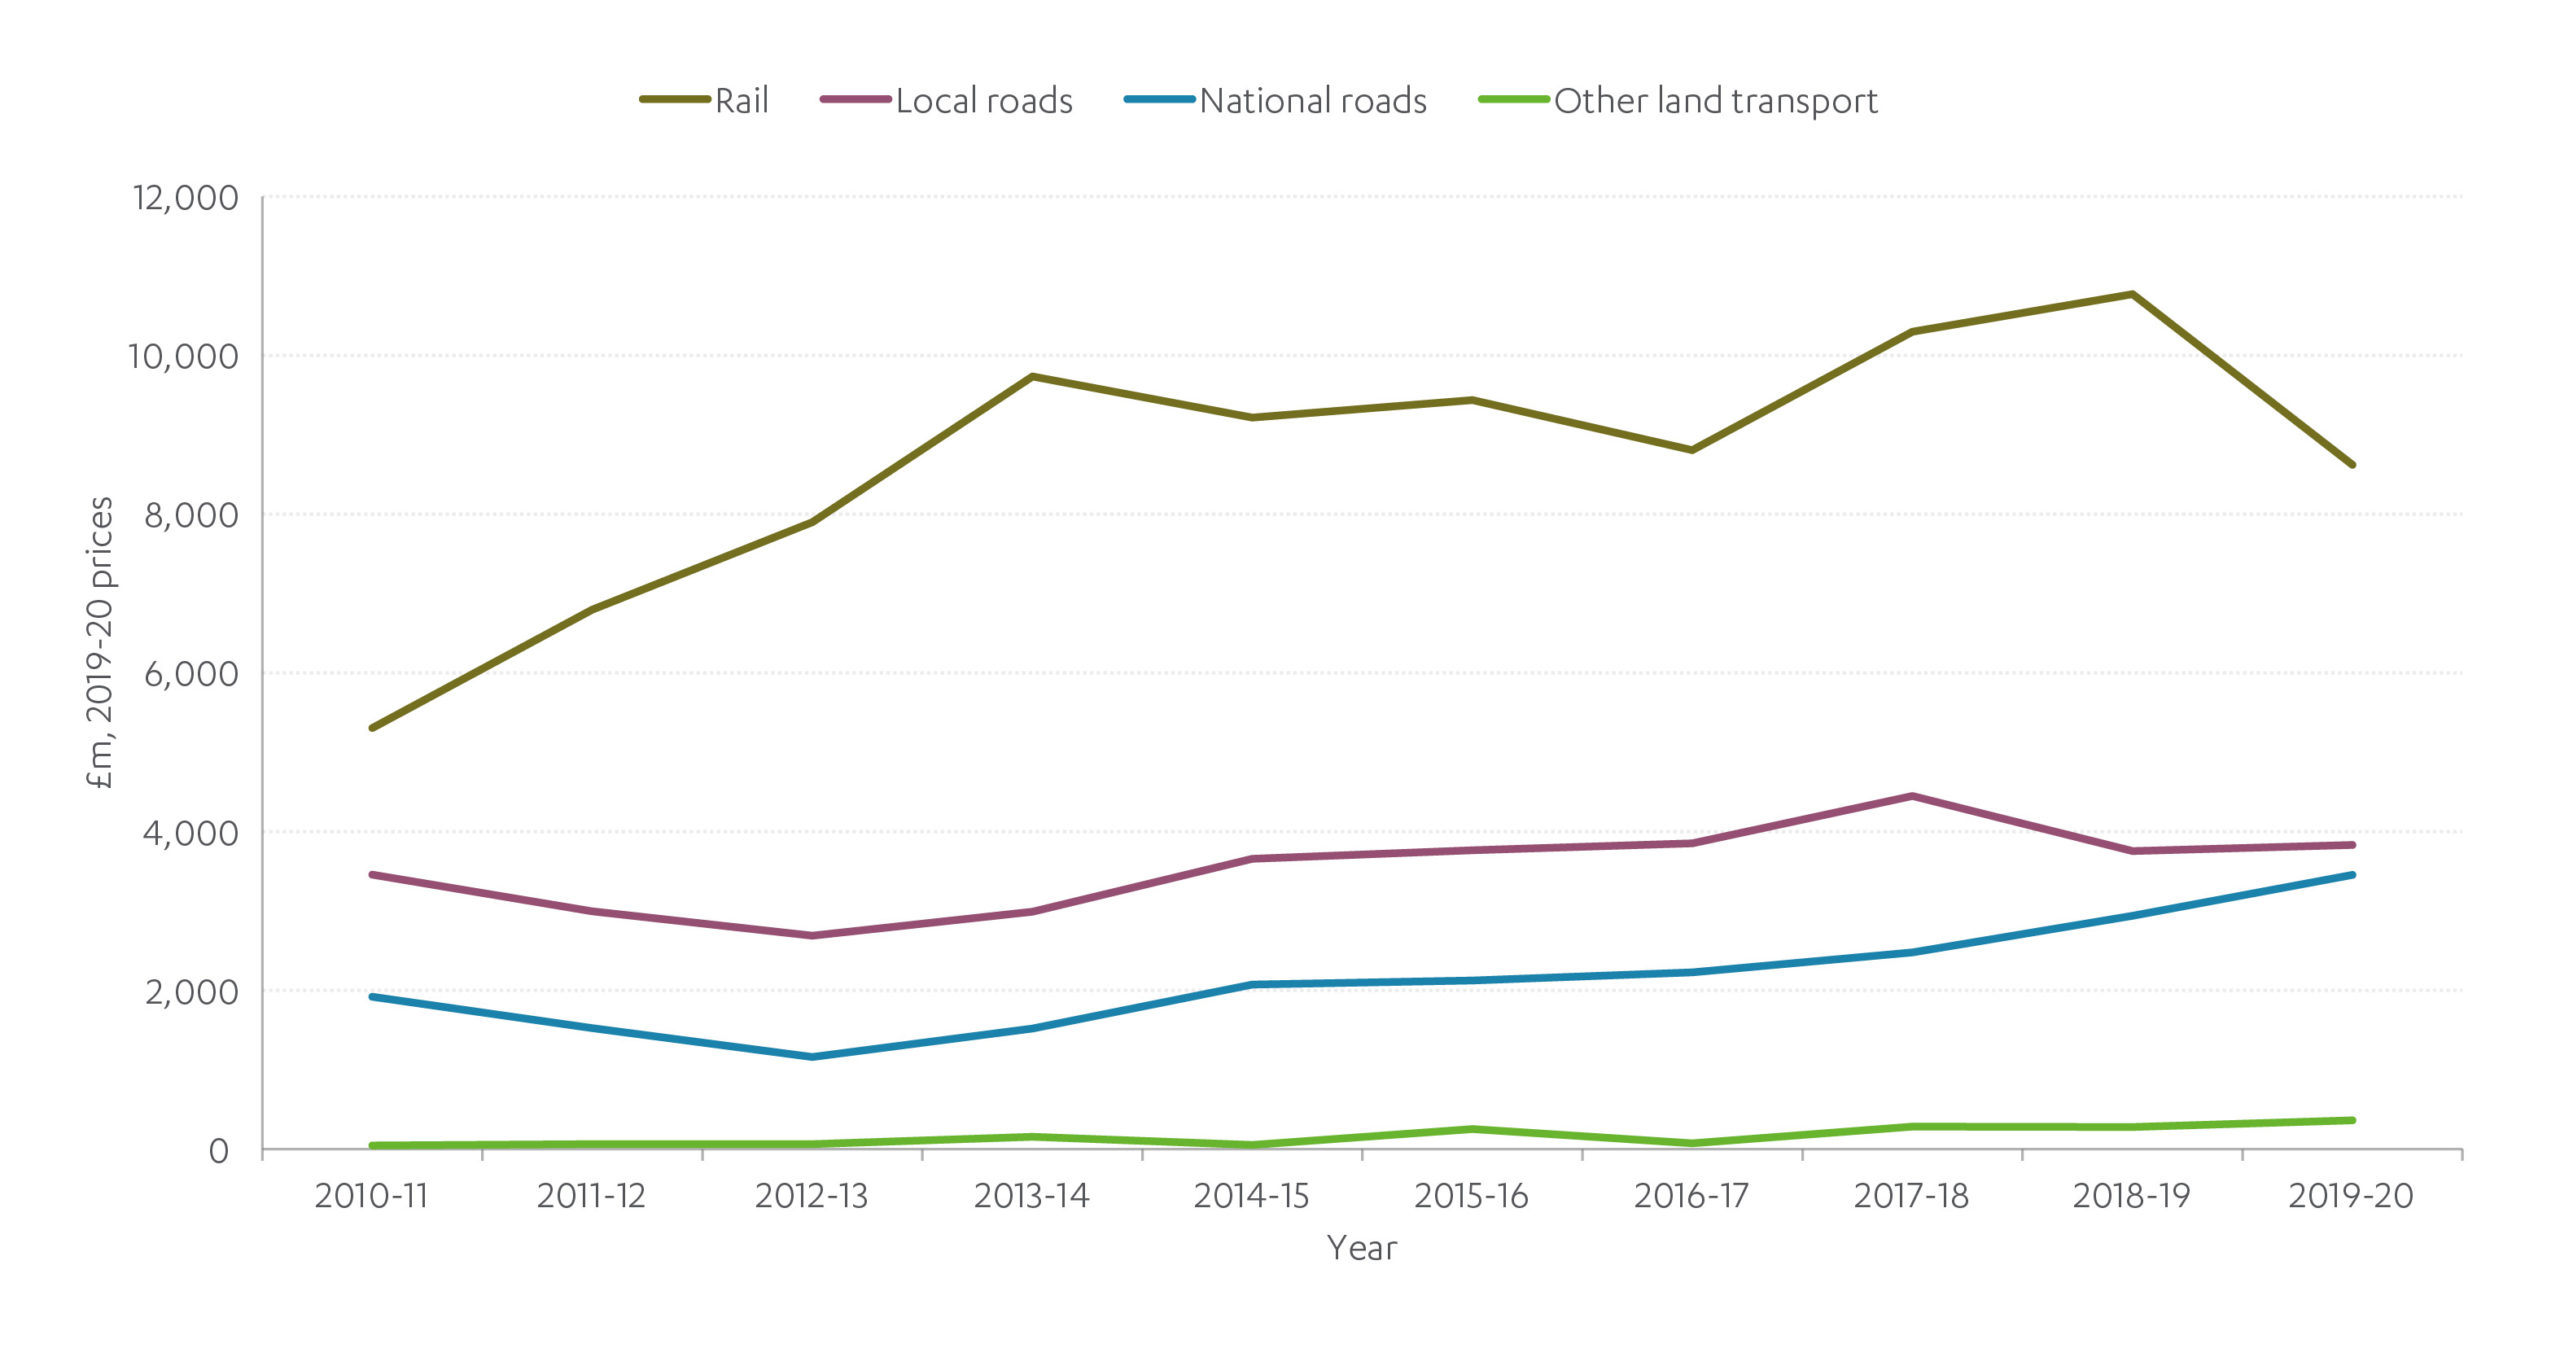
Source: Office for Road and Rail (2020), Private sector investment in the rail industry; Network Rail (2020), Network Rail annual report and accounts; Department for Transport (2020), Transport expenditure; International Council of Clean Transportation (2021), European Vehicle Market Statistics; NIC calculations
Investment in transport has risen in recent years. This trend is driven by household expenditure on new vehicles, with the trend reflecting that the vehicles bought are more expensive, rather than that the number purchased is increasing.
Investment in national roads has been steadily increasing since 2012 to almost match the investment made in local roads. Annual investment in rail more than doubled between 2010-11 and 2018-19 before falling back in 2019-20. This reflects financing for major new lines like HS2 and Crossrail, as well as programmes of capacity upgrades across the existing national network.
Next Section: Performance of the sector
The Commission has assessed the performance of each sector against four key criteria: quality, price, environment, and resilience.
Performance of the sector
The Commission has assessed the performance of each sector against four key criteria: quality, price, environment, and resilience.
There remain a number of significant issues for England’s transport system, particularly for surface transport modes. There are large variations in urban connectivity levels in different places; the largest urban areas tend to have the worst connectivity, as congestion slows down journeys affecting both passenger travel and freight. There are variations in interurban connectivity between similar places, but with no clear regional patterns or trends. While the public are largely satisfied with national road overall, public concern over the condition of local roads is high. Satisfaction with some specific rail routes is poor and there is wide variation across the rail sector. The safety of the transport network is good by international standards however improvements in road safety have plateaued over recent years.
Household expenditure on transport has remained broadly constant over the last three decades. Motoring costs make up the biggest category of expenditure and have remained flat. Spending on public transport fares have increased considerably but make up a much smaller part of household expenditure.
Transport is now the biggest contributor of greenhouse gases by sector. Emissions from road transport have increased since the 1990s, albeit more slowly than the increase in road traffic. Transport also emits non greenhouse gases that can be harmful to human health. These emissions have declined significantly over the last thirty years, however, they remain at illegally high levels.
Transport as a sector is vulnerable to the increased incidence of extreme weather as a result of climate change. However, on the road network delays are much more likely to be caused by congestion than infrastructure failure.
Quality
There is no common approach to measuring transport quality across different modes and places. Useful metrics include connectivity (urban and interurban) and customer satisfaction which are considered below.
Connectivity
Connectivity refers to the effectiveness of the transport network at getting people and goods from one location to others. In 2018, the Commission developed a metric to analyse urban and interurban connectivity across built up areas in Great Britain, for car and public transport journeys (which includes bus, coach, and rail, as well as walking for shorter journeys). The metric is based on the relative speed of travel within and between built up areas, with higher scores indicating better connectivity.60
Urban connectivity and congestion
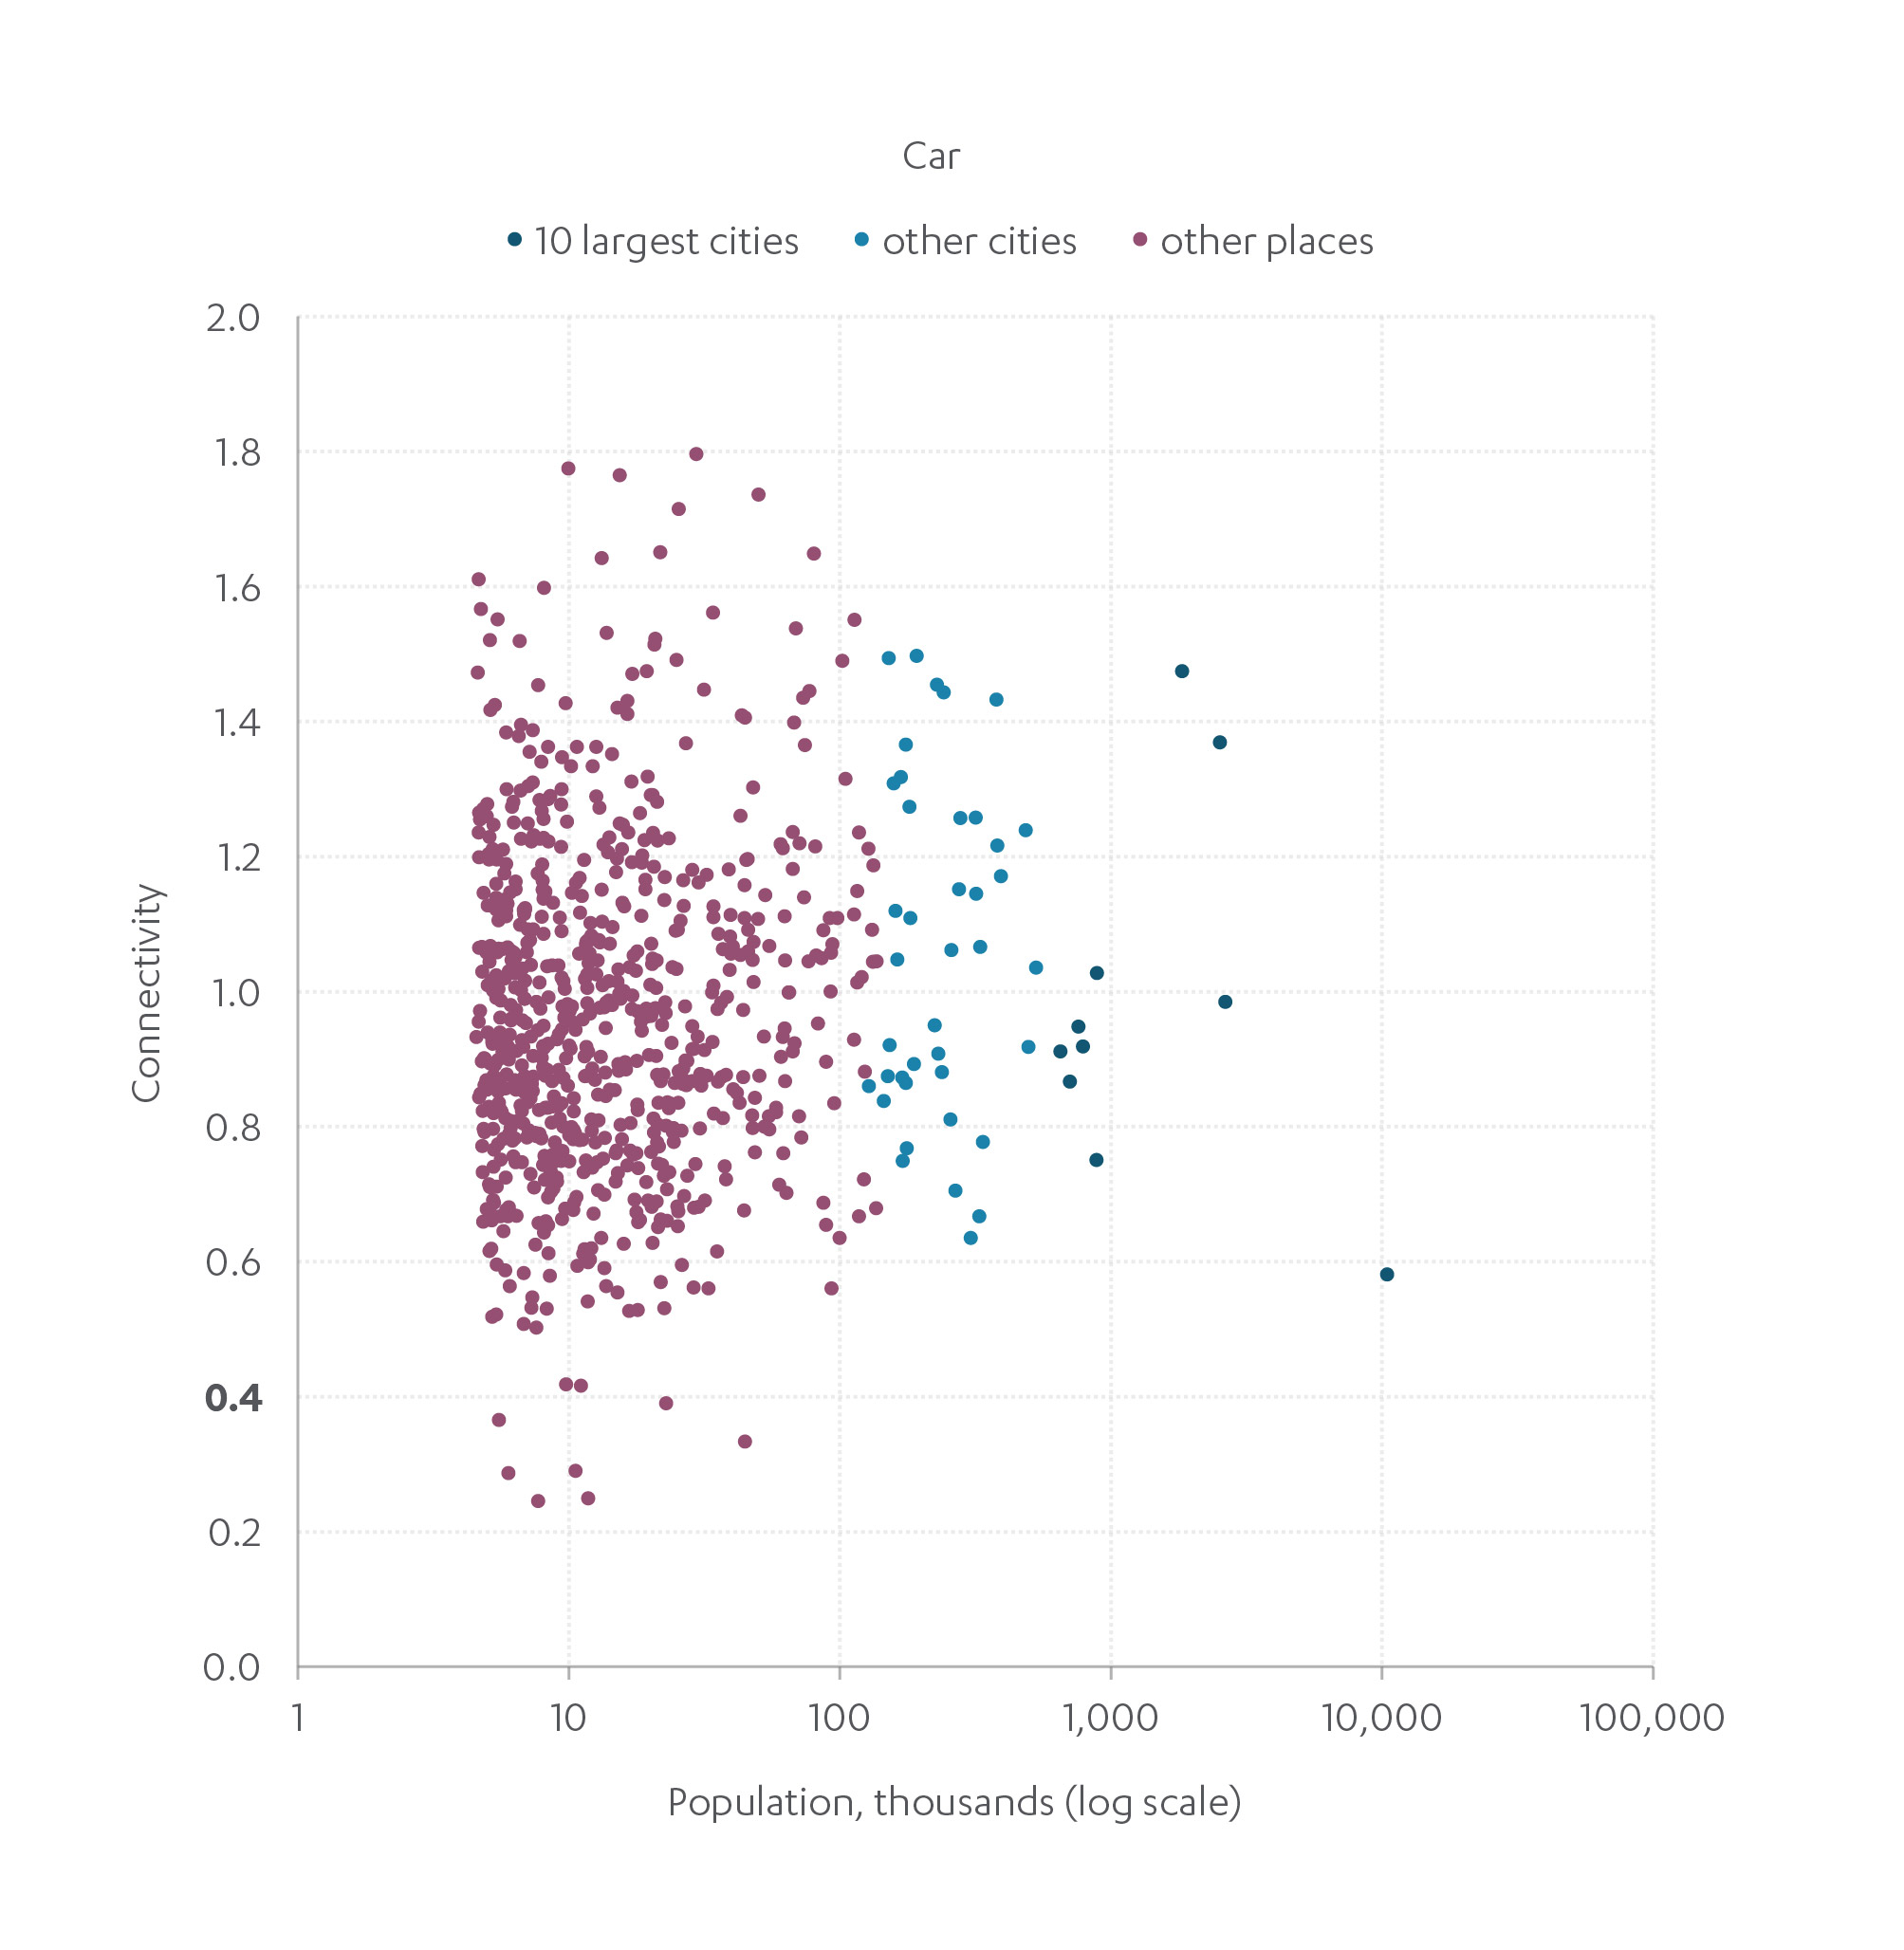
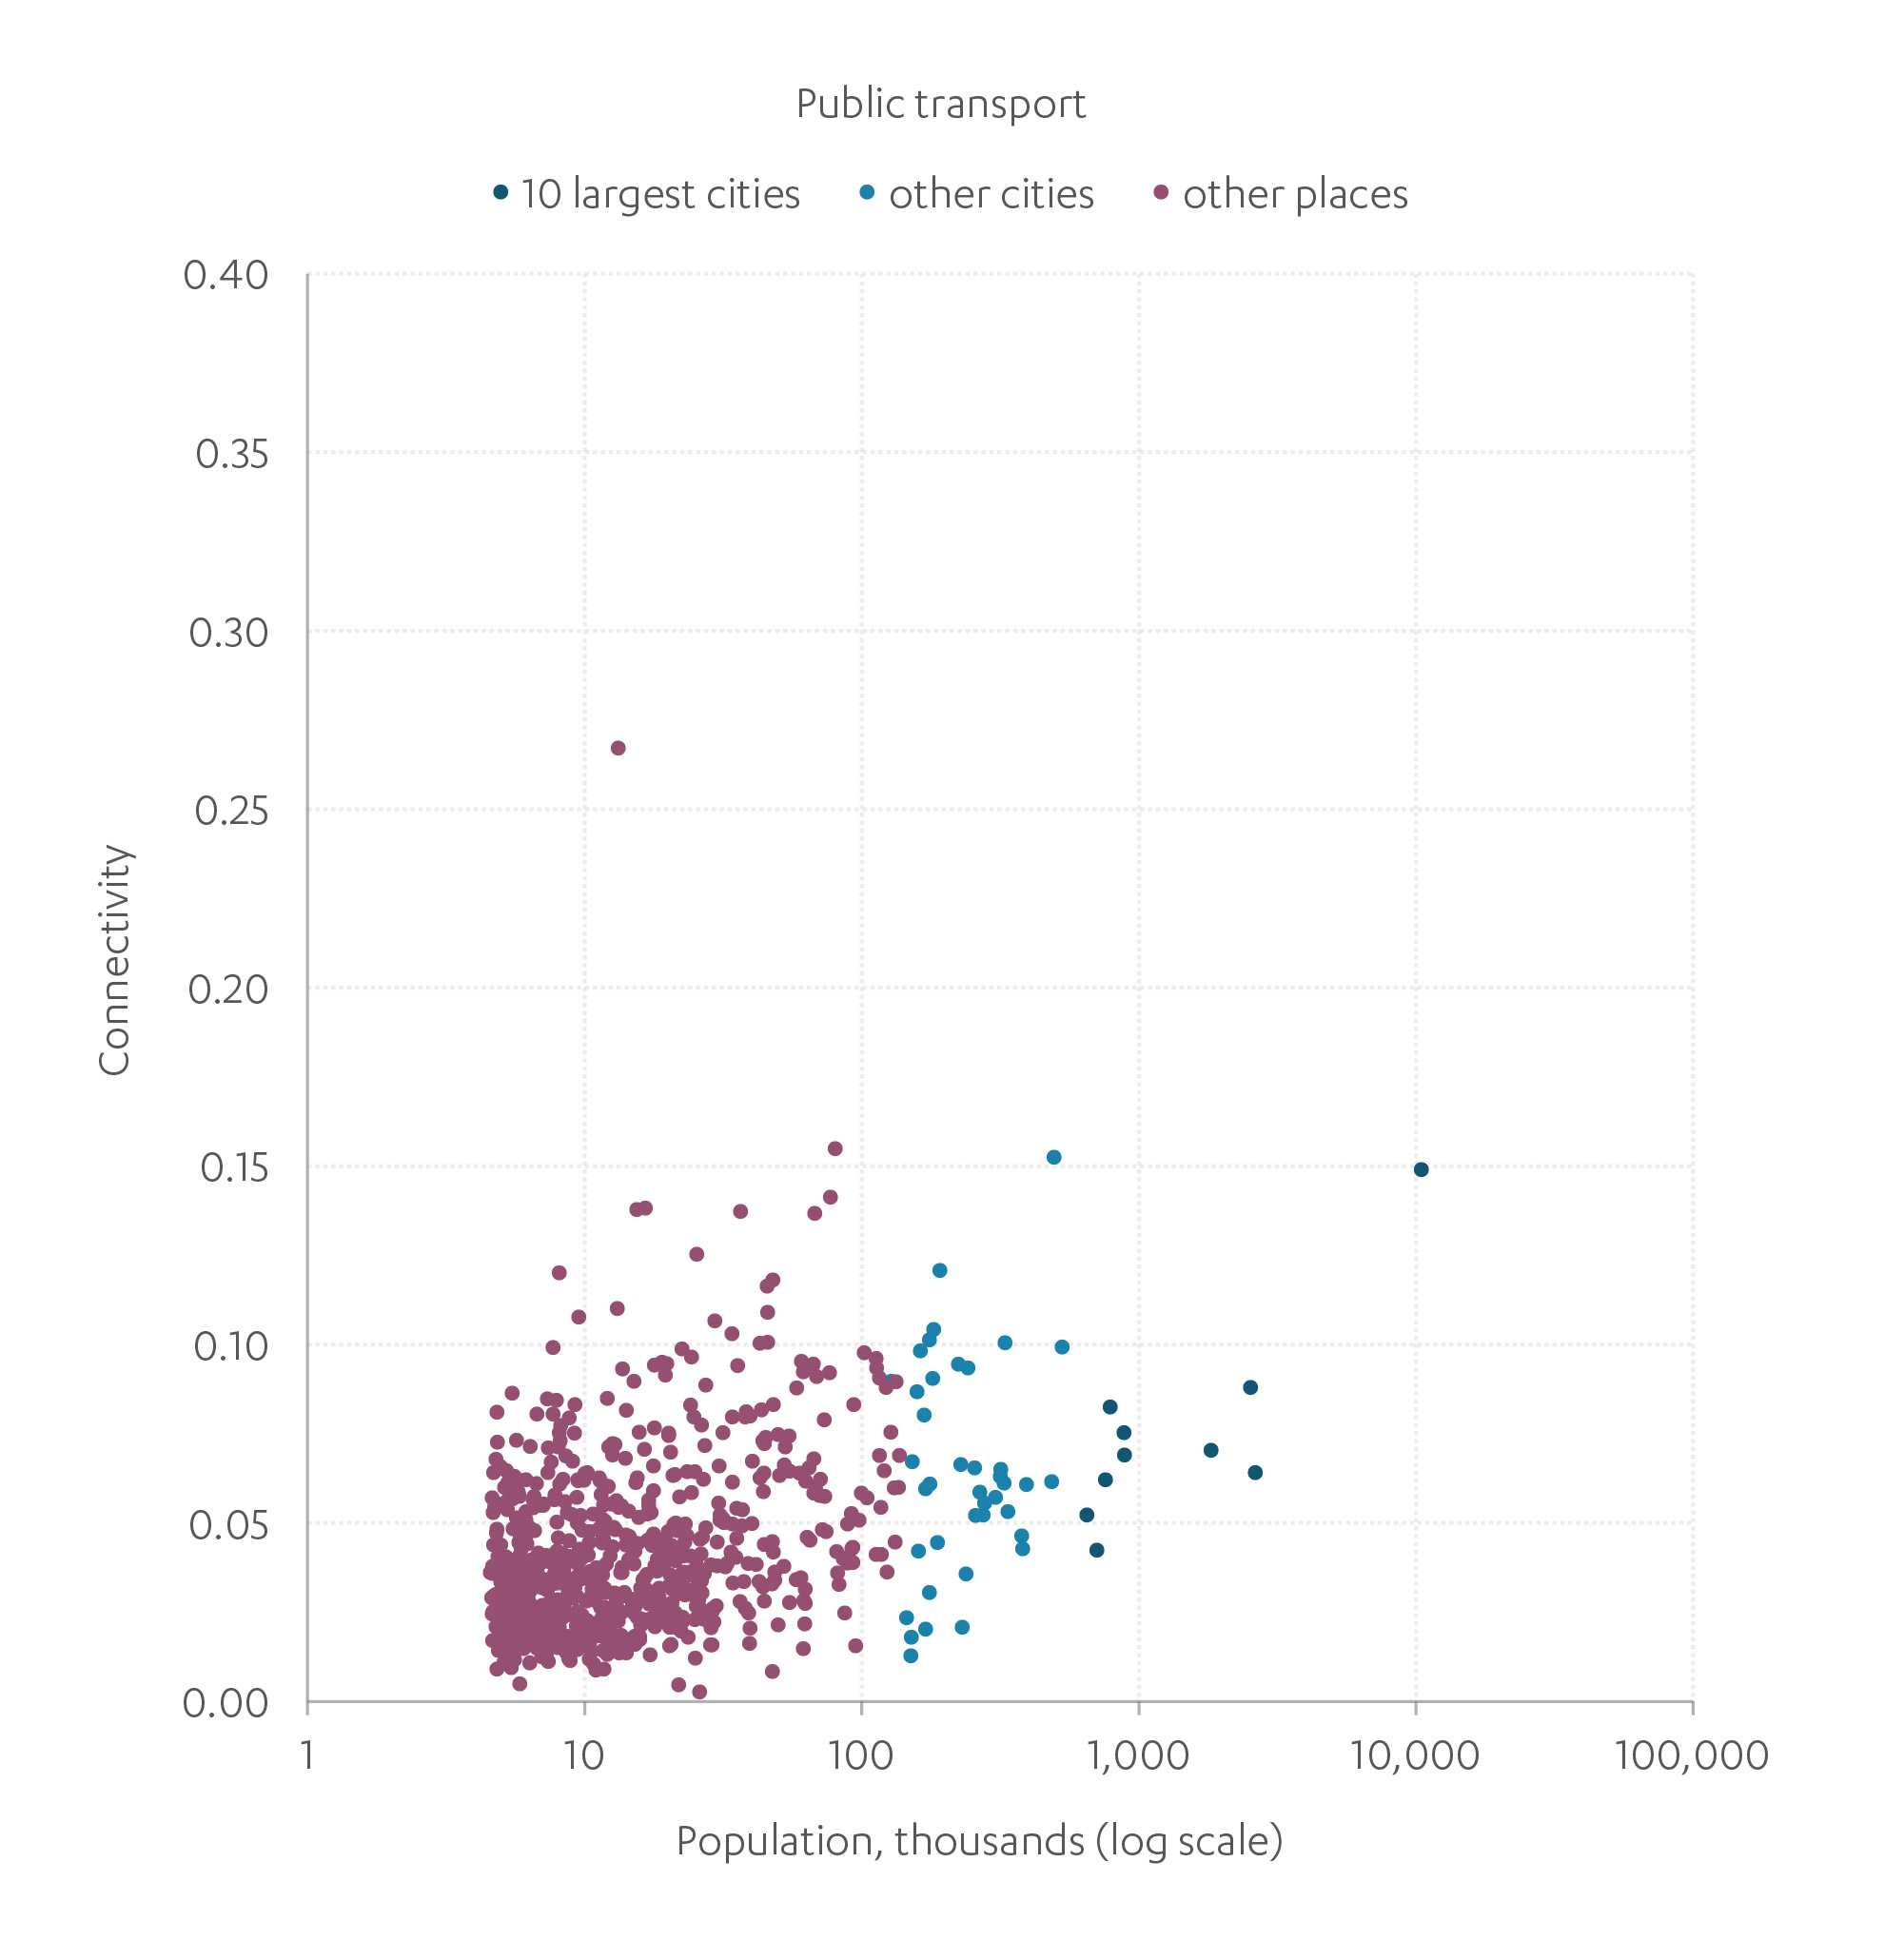
For journeys within urban areas, figure F.5 shows that connectivity is generally better by car than public transport across cities and towns. Car connectivity becomes consistently worse as the population of a built up area increases, as congestion increases with density. A similar trend is visible for public transport connectivity, but with a far greater variation among places of a similar size. This likely reflects a variation in the level of public transport provision between places (often due to historic patterns of investment), along with the congestion associated with larger places. The effect of congestion on bus operations in particular can result in a vicious cycle, as congestion not only slows down buses but can require operators to increase service frequency to compensate. This increases costs and can make some services unviable.61
Figure F.5: Urban peak time connectivity is better by car than public transport, although connectivity by both modes is worse in larger cities
Urban connectivity in England’s most populated built up areas, 2016
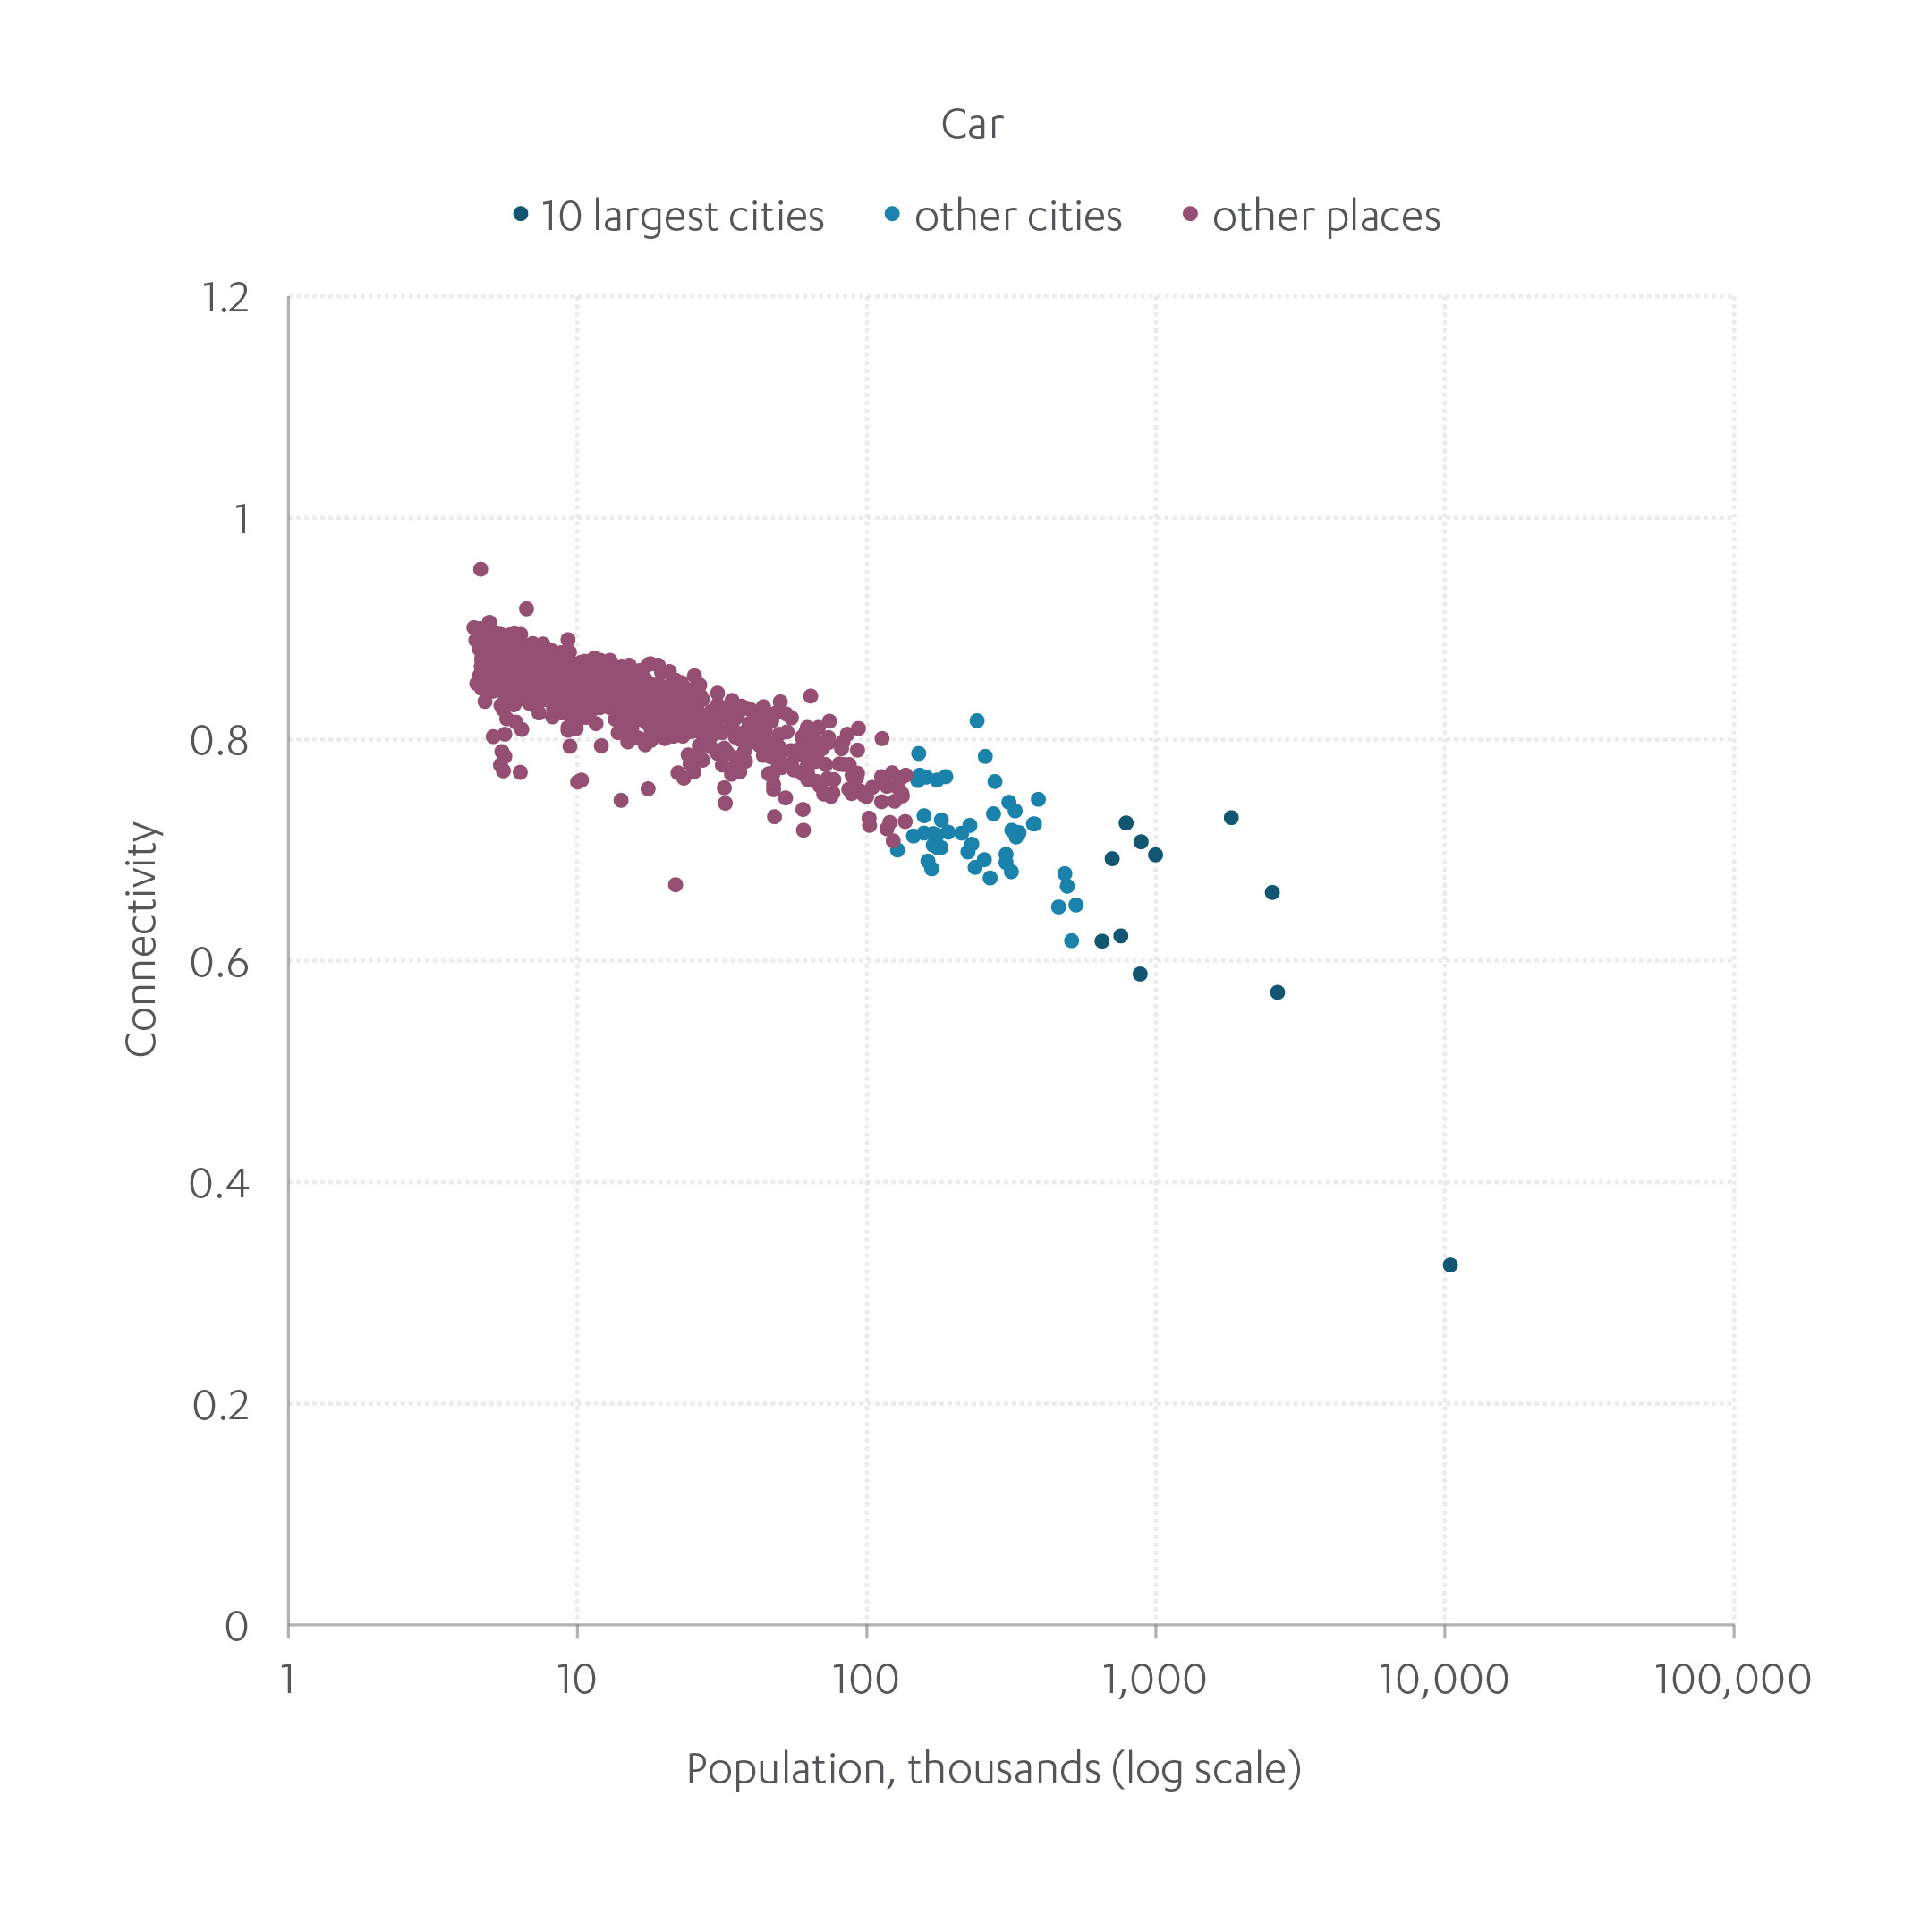

Source: National Infrastructure Commission (2019), Connectivity Dataset
Figure F.6 illustrates further how congestion is the cause of poor connectivity in cities. At off peak times, the largest cities have better connectivity performance, suggesting that the road network itself may provide more direct routes. However, as shown above, peak time connectivity is worse rather than better in larger cities – with delays caused by the volume of traffic exceeding the capacity of the road network to accommodate it.
The effects of congestion are illustrated in the second chart in figure F.6, where the ratio between peak and off peak connectivity represents the impact of congestion on travel times. In towns with a population of under 100,000, connectivity at peak times has typically been around 10 per cent poorer than off peak, and virtually never more than 20 per cent poorer (i.e. a score of 0.8 means that congestion reduces connectivity performance by around 20 per cent). It is only cities of more than about half a million people that see the most serious congestion effects, with connectivity 40-50 per cent worse at peak time.
Figure F.6: Congestion reduces urban connectivity at peak time, especially in larger places
Urban car connectivity at off peak and congestion within England’s most populated built up areas, 2016
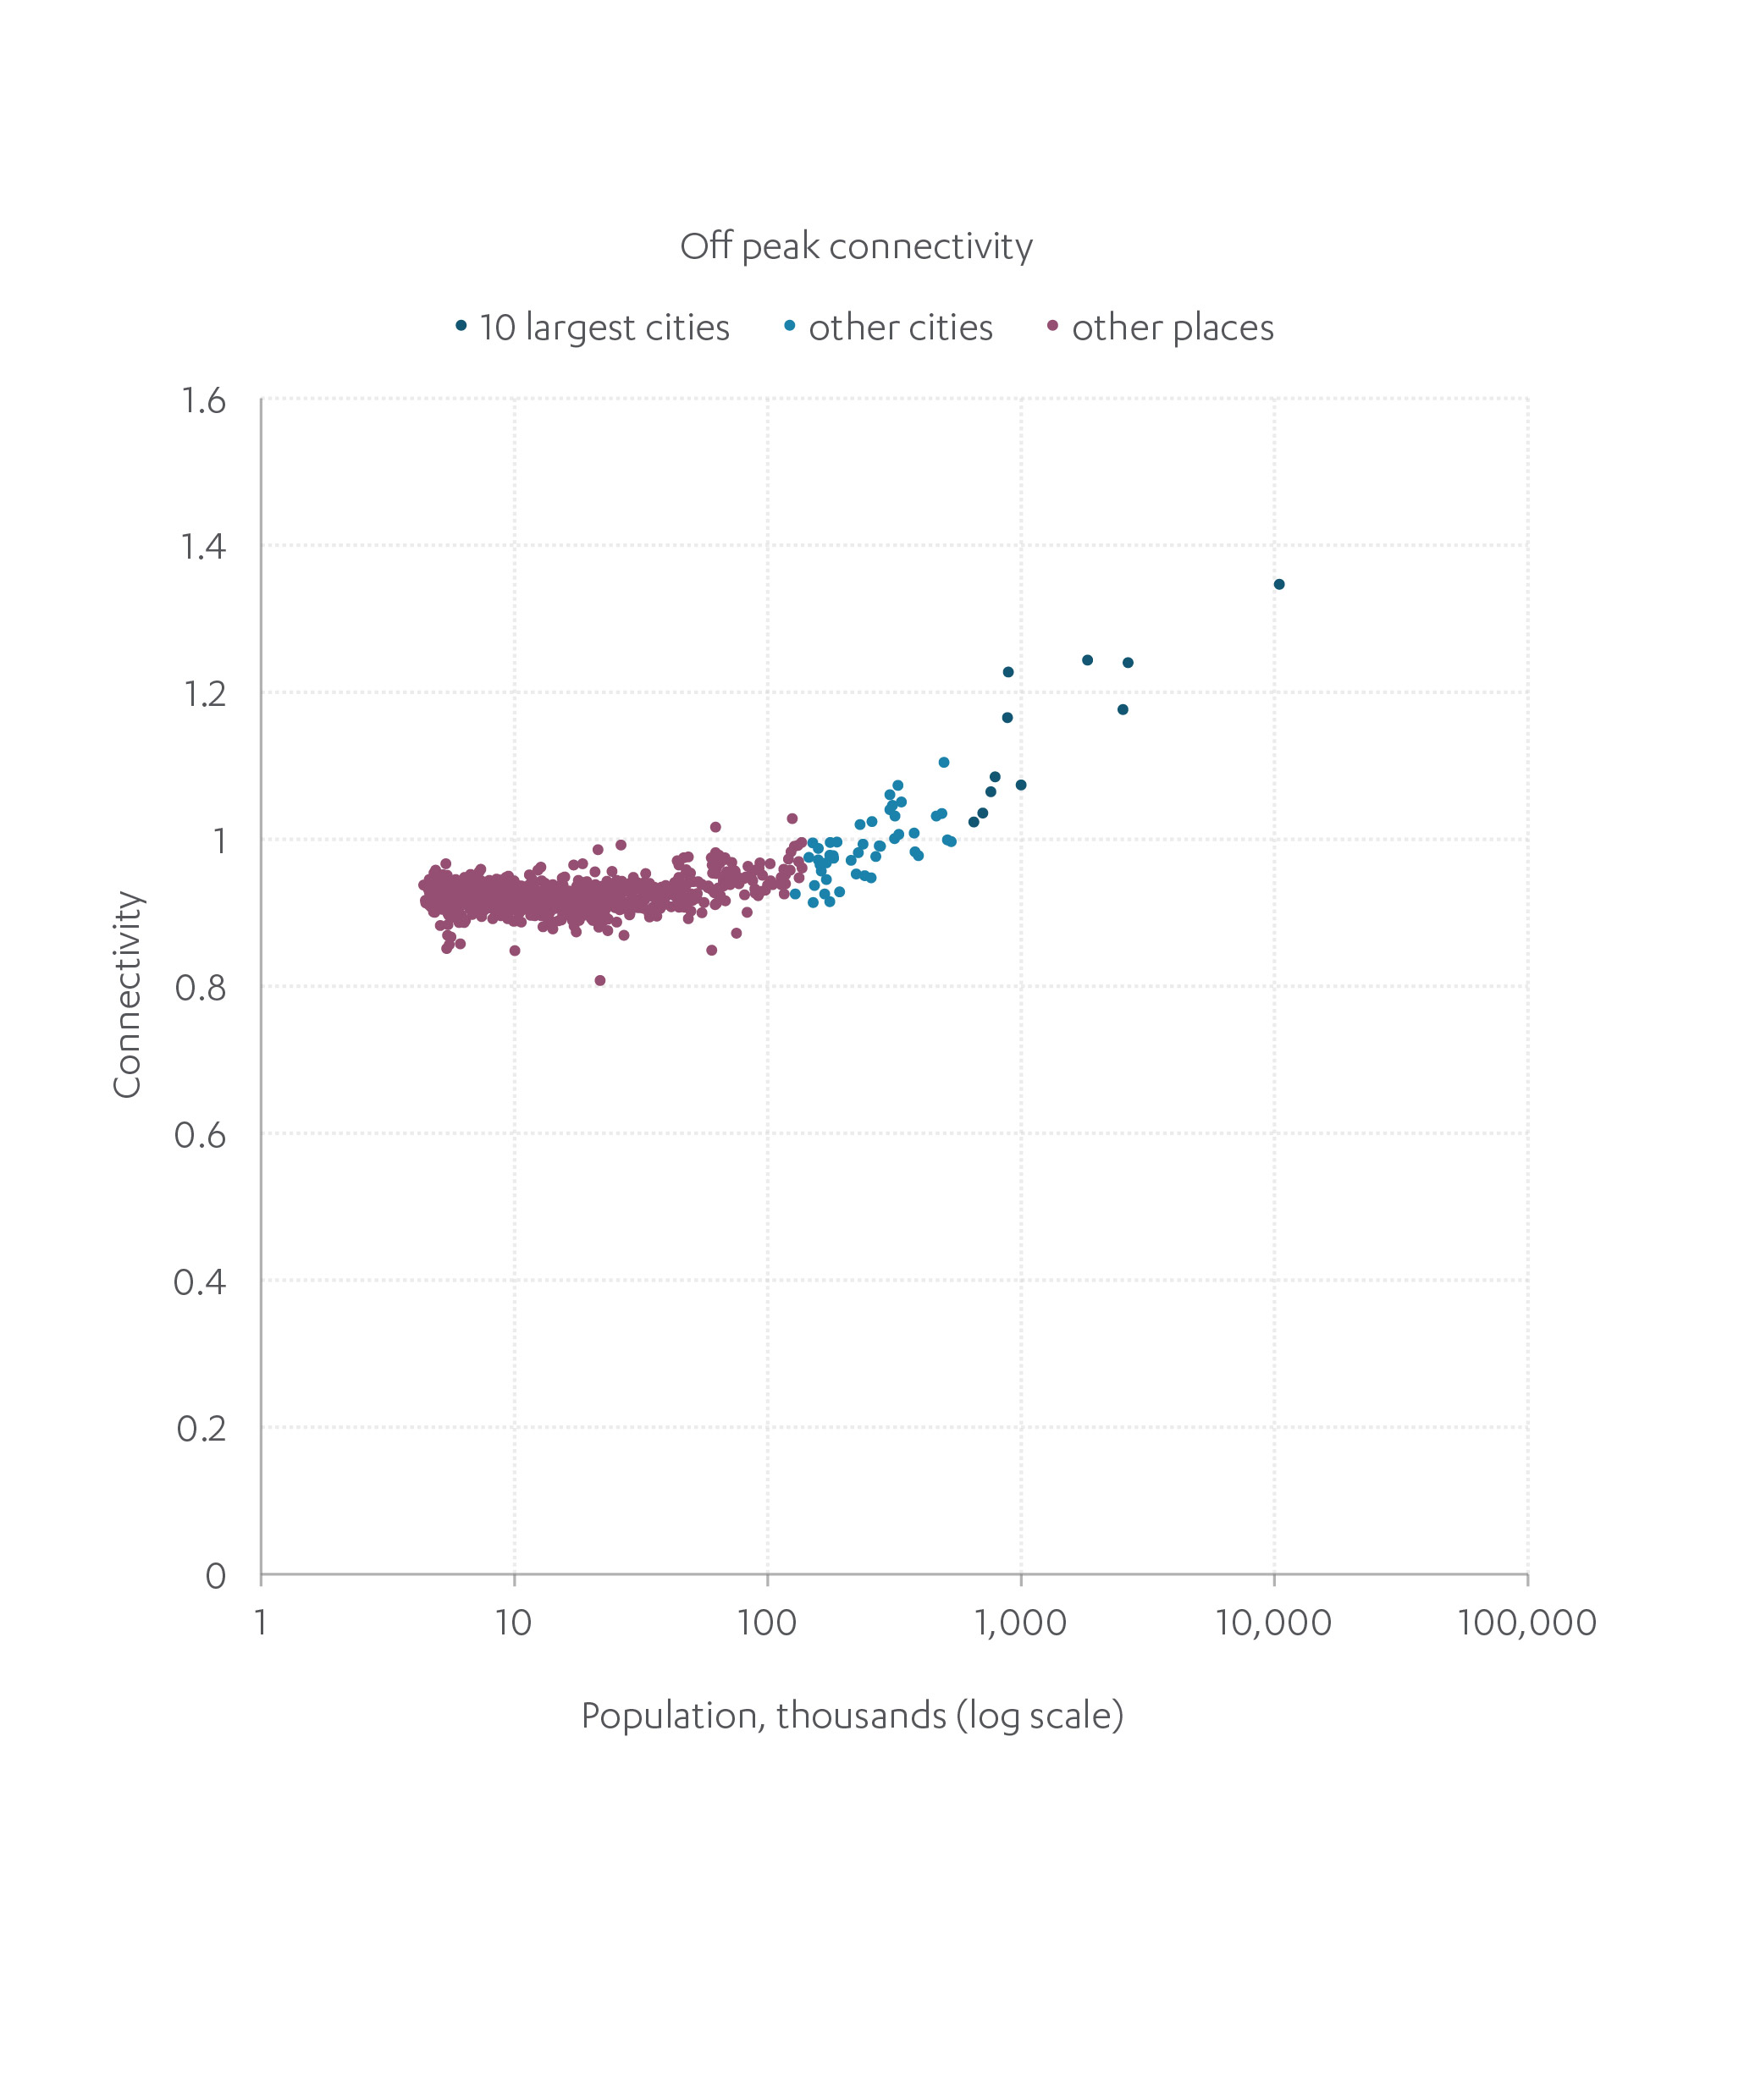
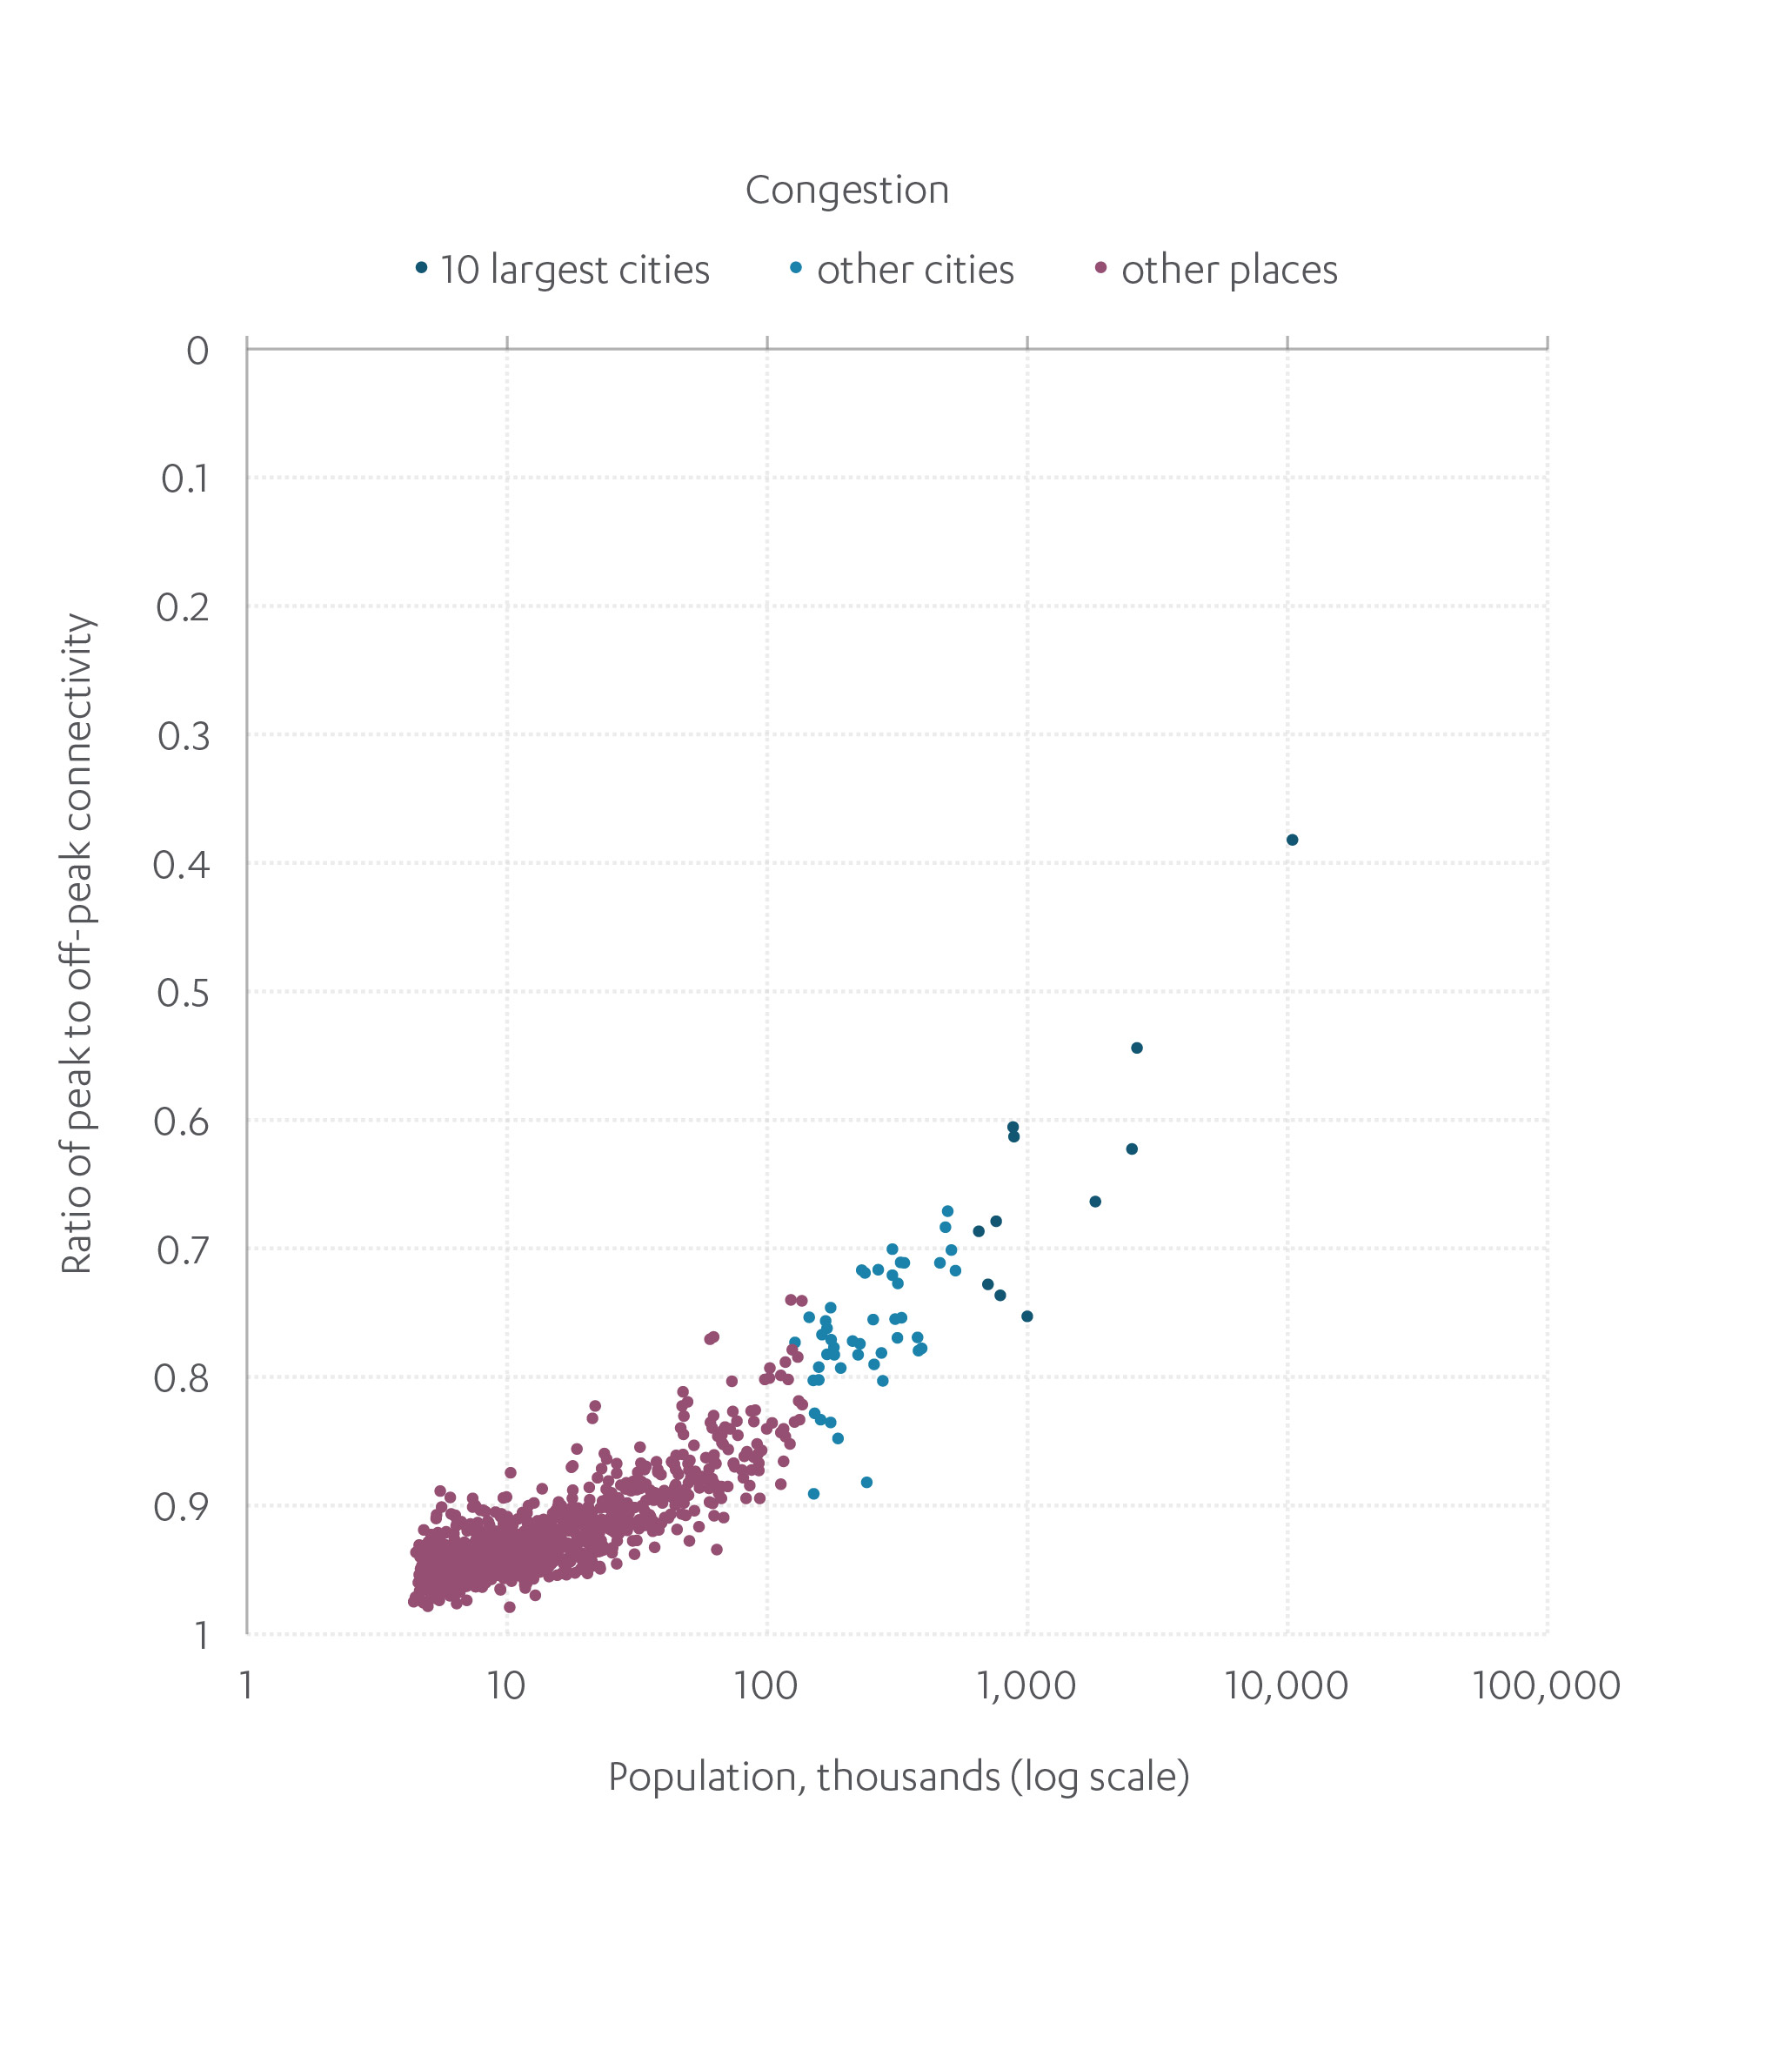
Source: National Infrastructure Commission (2019), Connectivity Dataset
Interurban connectivity
For interurban journeys, connectivity is also better by car than public transport. This is due to the widespread coverage of the road network, which provides more direct links between places than rail or bus. For many places there is a need to take a more circuitous route when taking public transport.
There are variations in interurban connectivity between built up areas, however this variation does not show a clear geographic pattern. Figure F.7 illustrates how interurban connectivity performance varies among built up areas according to their population size, by both car and public transport. This variation in interurban connectivity is not neatly explained by the size of a place – large and small settlements both show significant variation.
Figure F.7: Interurban connectivity is better by car than public transport
Interurban connectivity for England’s most populated built up areas, 2016
Source: National Infrastructure Commission (2019), Connectivity Dataset
Similarly Figure F.8 shows that interurban connectivity by car varies significantly within English regions, but does not show a clear pattern of variation between regions. London performs worse than other regions for car connectivity, reflecting that, as an entirely urban area, car journeys to all other destinations begin with travelling through high levels of congestion.
Figure F.8: Interurban connectivity is relatively similar across different regions, except London, both by car and public transport, and varies more within regions
Interurban connectivity by region at peak time 2016 – distribution of built up areas within each English region (median indicated by cross line, interquartile range by blue box, main range by extended lines, and statistical outliers by dots)

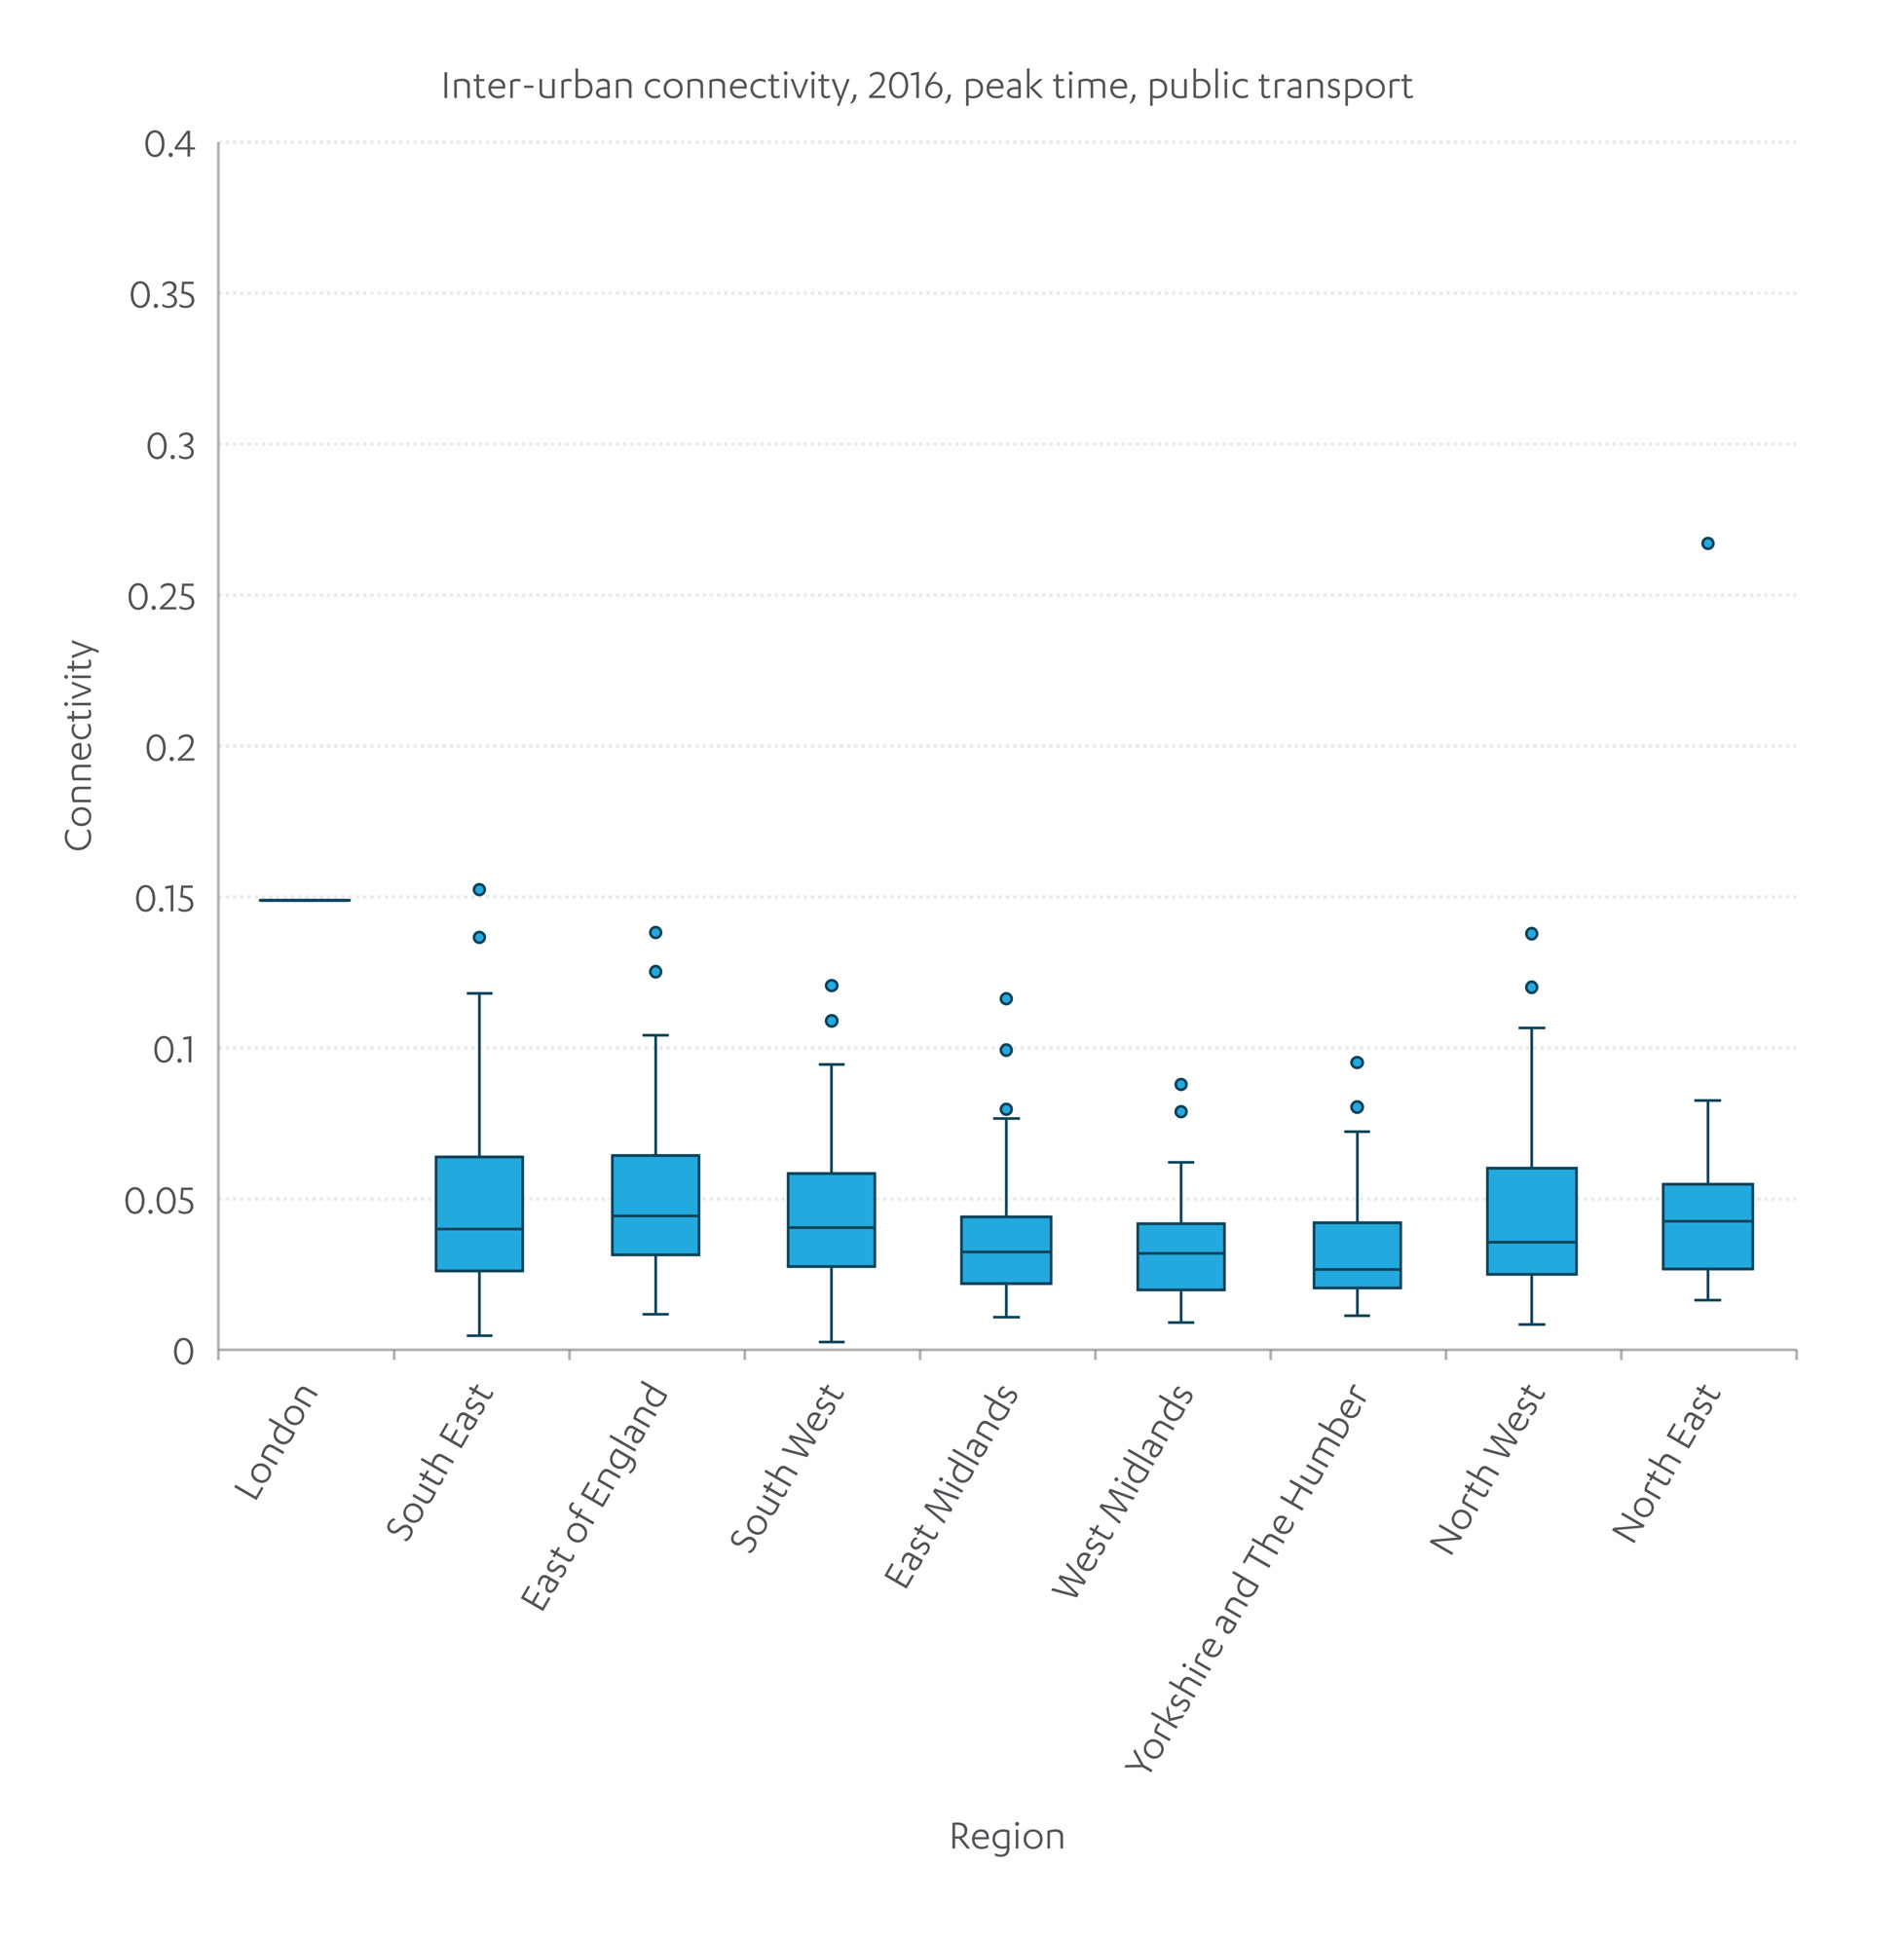
Source: National Infrastructure Commission (2019), Connectivity Dataset
Looking particularly at rail, there are some clearer patterns in regional performance. Rail journeys between major cities in the Midlands and the North tend to be slower than those in London and the South East, and slower than those in regions with high productivity in other countries like Germany and the Netherlands. This is particularly true for shorter distance rail journeys.62
The observed differences in connectivity between car and public transport can have wider social and economic impacts. Twenty two per cent of households do not own a car or van and this rises to 65 per cent of those in the lowest income decile.63 Those who depend on bus services tend to be lower paid, live in more deprived areas and are more likely to turn down jobs due to transport issues.64 Bus use is also more common for people aged from 17 to 20, or over 70, and for women.65
User satisfaction
The latest National Travel Survey indicates that the public are generally satisfied with transport infrastructure. In 2019, overall satisfaction with rail journeys, bus journeys and the strategic road network stood at 82 per cent, 89 per cent and 81 per cent respectively. Satisfaction with rail has increased from 76 per cent in 1999, and while only recent data is available for bus and strategic roads, satisfaction has increased slightly over the past five years.66
However, levels of user satisfaction vary across the country and according to mode. For rail, satisfaction with different train operating companies varies from 72 to 96 per cent, with wider variation in satisfaction with value for money (29 to 81 per cent), punctuality and reliability (52 to 95 per cent) and crowding (52 to 89 per cent).67 For buses outside London, satisfaction varied from 76 to 95 per cent, with wider variation in factors such as value for money (50 to 77 per cent) and punctuality (53 to 84 per cent).68
The Commission’s social research also shows that public confidence in transport has improved since the first Assessment, with 73 per cent confident the sector would meet their needs in the next 30 years, up from 61 per cent in 2017. Confidence was significantly higher among respondents from London and other cities, but decreased for those living in villages and hamlets. Thirty three per cent of respondents ranked roads as most in need of investment, with electric vehicle charging infrastructure and railways both at 15 per cent, and bus services at 12 per cent.69
Price
Figure F.9 shows household expenditure on transport has remained broadly similar over the past thirty years except for a spike in the late nineties. Households spent around £3,o00 on motoring in 2018-19. This includes the purchase of vehicles, the cost of spares, accessories, repairs and servicing, and fuel costs. The increase in the late 1990s was driven by purchasing new vehicles, and has since returned to the levels seen in the early 1990s.
Figure F.9: Expenditure on road transport has fallen since peaking in the late 1990s, while expenditure on public transport fares has increased in the last decade
Annual household expenditure on motoring and fares and other travel costs, and expenditure per mile travelled by households, 1990 to 2018-19
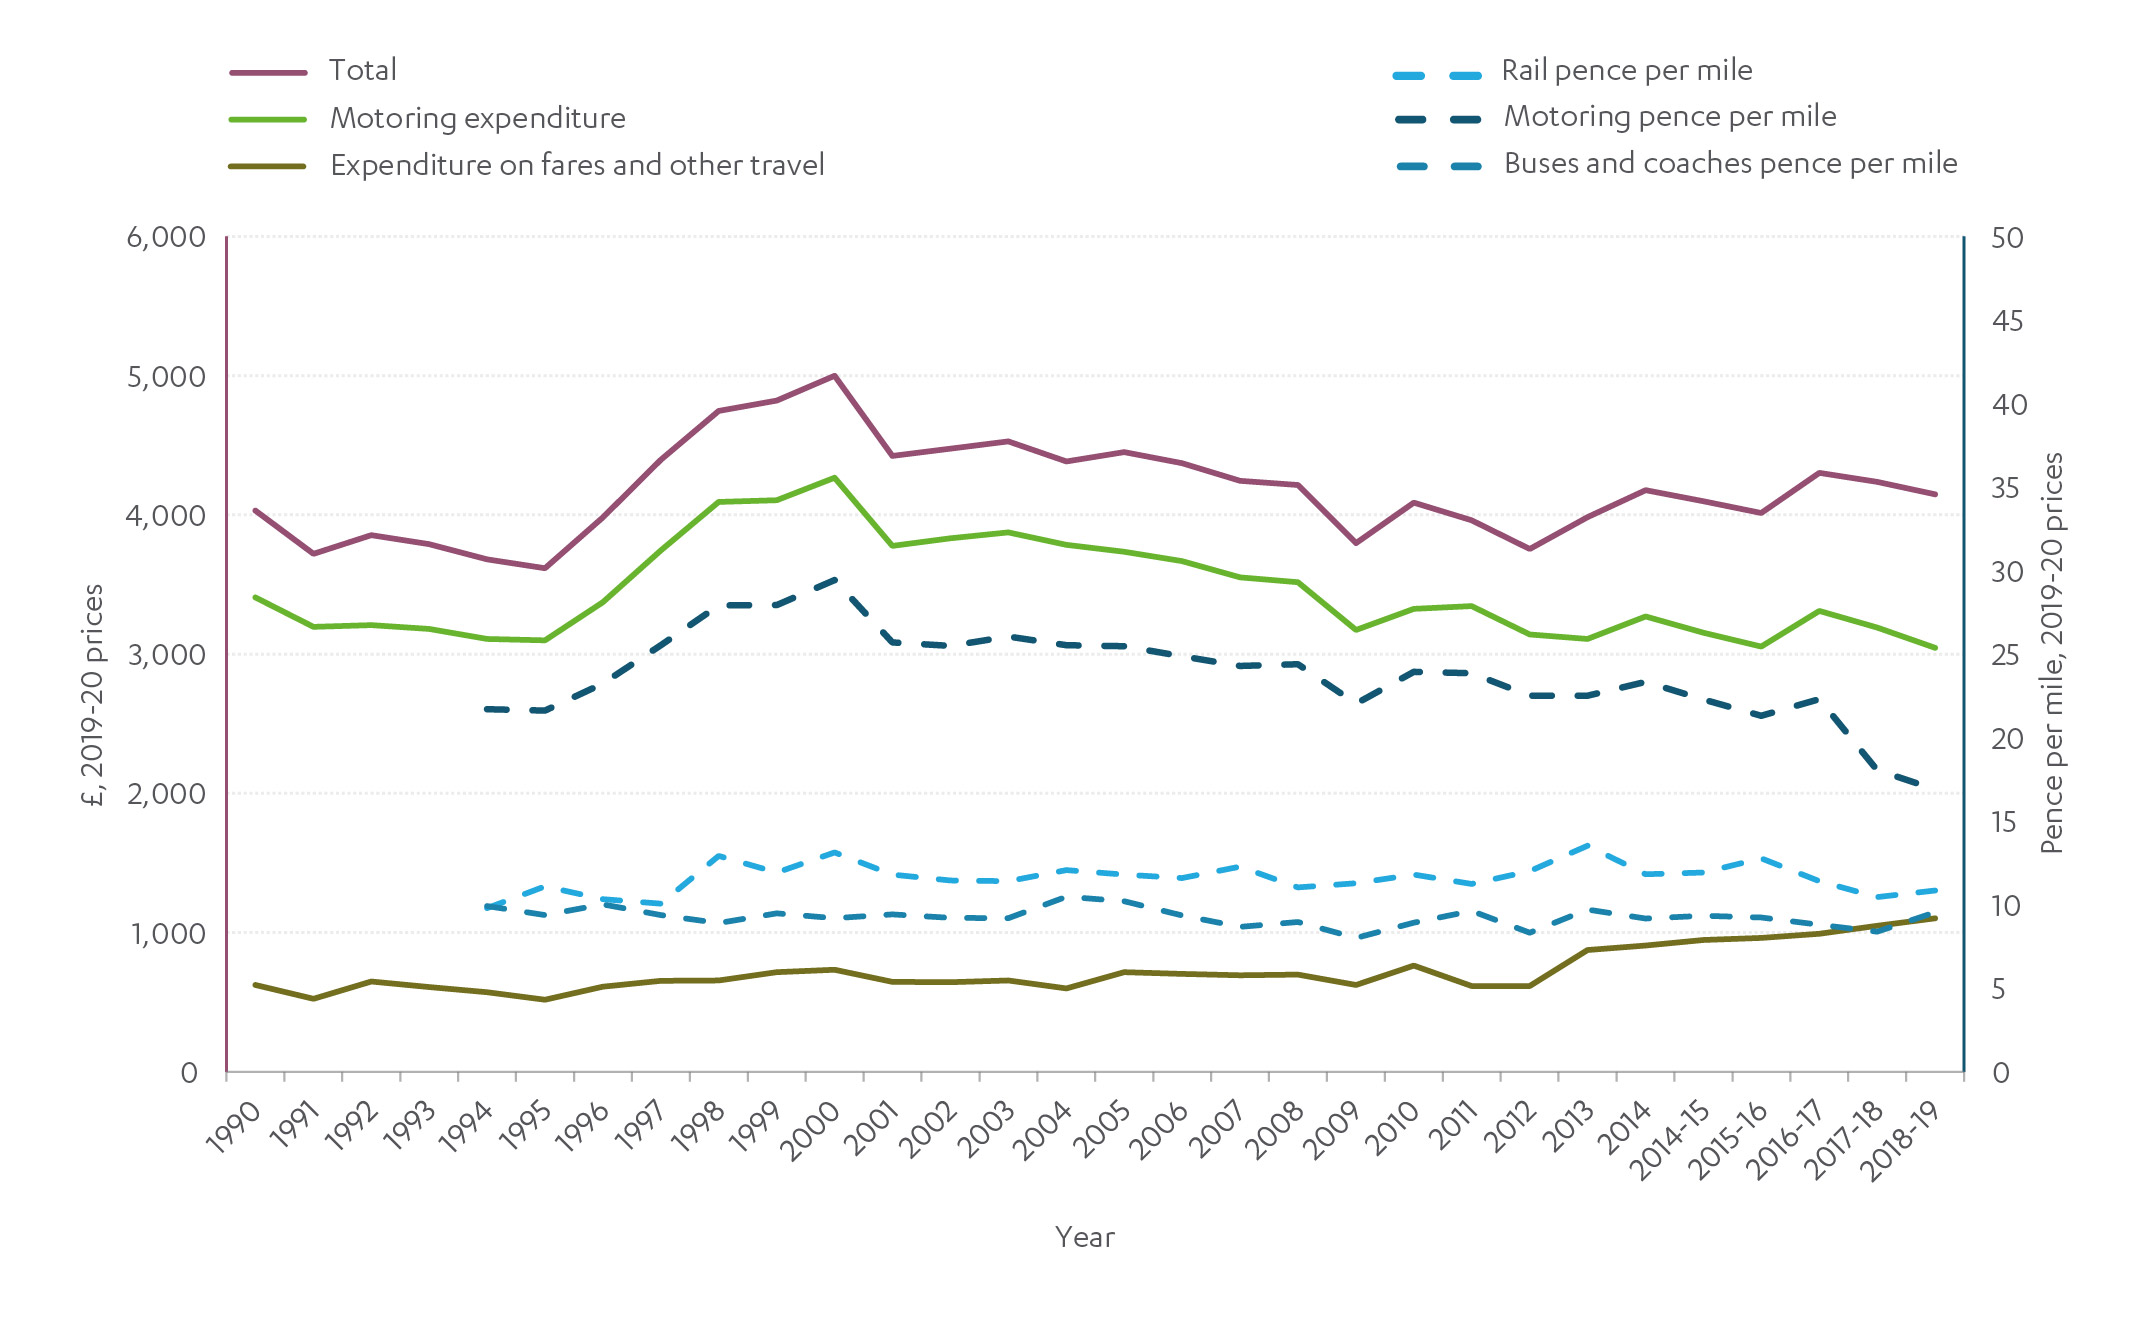
Source: Department for Transport (2020), Household expenditure on transport (Motoring figures include fuel duty but not vehicle excise duty)
Although expenditure on public transport fares has remained consistent per mile travelled, fares charged for individual journeys have increased over the last two decades. This shows that people have been making different types of journey, increasing their use of transport routes with lower fares. For instance an increasing share of bus passenger journeys have been made in London, where fares per journey are lower.70 Bus fare expenditure by households has also been reduced by the increasing share of bus journeys undertaken by people with a concessionary pass, which was introduced in 2008.71
Changes in the price of different transport options will have an effect both on how people choose to travel, and whether or not to travel at all. Travellers are not always able to substitute one mode for another – for instance a switch from a car to bus is not possible if there is no bus route available. The availability of choice of mode is different in different places meaning there is spatial variation in the way price impacts people’s travel choices.
Environment
Greenhouse gas emissions
In 2019, greenhouse gas emissions from the transport sector accounted for 33 per cent of the UK’s total emissions, the single largest source. Around two thirds of these emissions were from surface transport.72
Since around 1990, emissions from road transport have increased more slowly than the increase in road traffic.73 This is attributable in part to marginal improvements in the efficiency of internal combustion engines.74 However, these gains have been offset in recent years by the trend towards larger and higher emitting vehicles.75 Addressing emissions from road use is particularly a problem for longer distance travel – journeys longer than ten miles account for 69 per cent of distance driven by car.76
Aviation and shipping accounted for around one third of transport emissions, mainly from international aviation. Before the pandemic, emissions from international aviation had increased 88 per cent from 1990 levels.77
Emissions from rail account for only one per cent of UK transport emissions and have fallen in recent decades despite increased use.78
Figure F.10: Most surface transport emissions are from road vehicles, which have remained stable in recent years
Estimated greenhouse gas emissions by transport category, UK
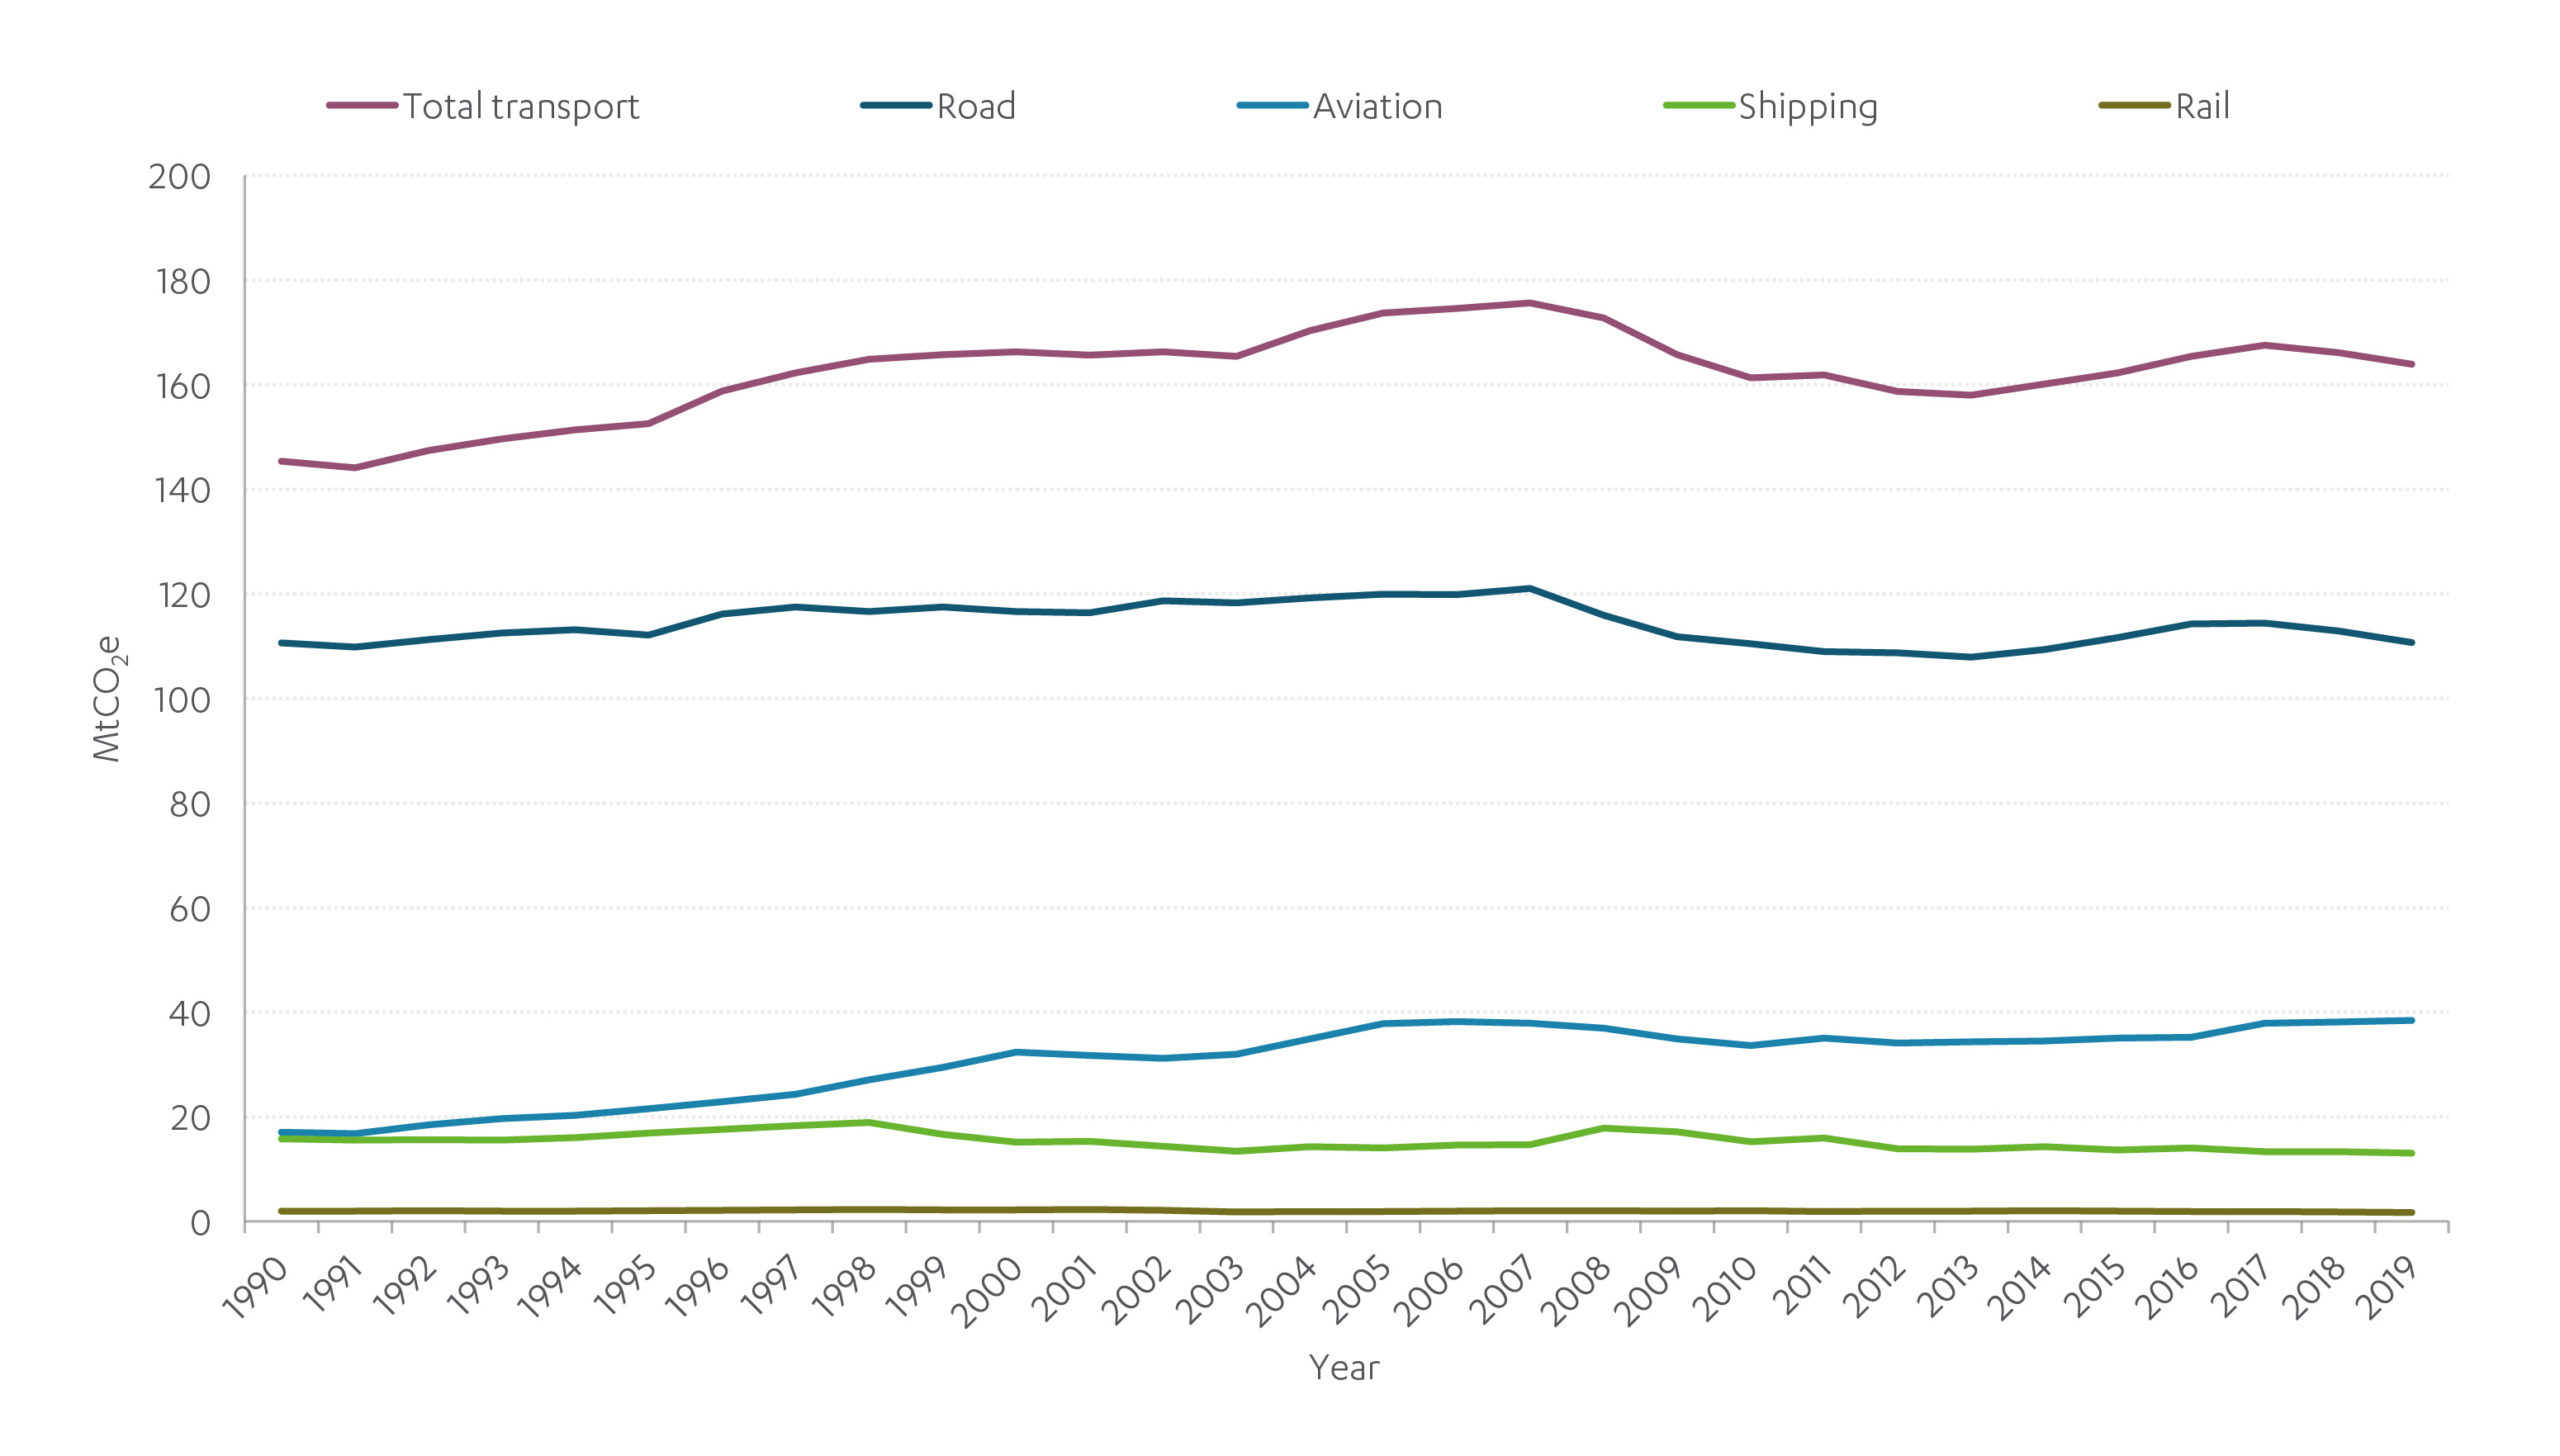
Source: BEIS (2020), Provisional UK greenhouse gas emissions national statistics 2019
Air pollution
In 2018, emissions of air pollutants from transport accounted for 34 per cent of total nitrogen oxides emissions across the UK, along with 13 per cent of total particulate matter 2.5 (PM2.5) emissions and 11 per cent of total particulate matter 10 (PM10) emissions. Most are emitted by road transport. For road transport, emissions fell between 1990 and 2018: nitrogen oxides by 79 per cent, PM2.5 by 59 per cent, and PM10 by 47 per cent.79
Despite this improvement enforcement action was commenced against the UK by the European Commission in 2016 for failing to improve emissions levels quickly enough.80 Many roads –especially urban roads – still have dangerous levels of air pollution.81
Figure F.11 Total transport airborne pollutants have been in decline for over twenty years
Air pollutant emissions from road transport, 1990-2018 indexed to 1990 values
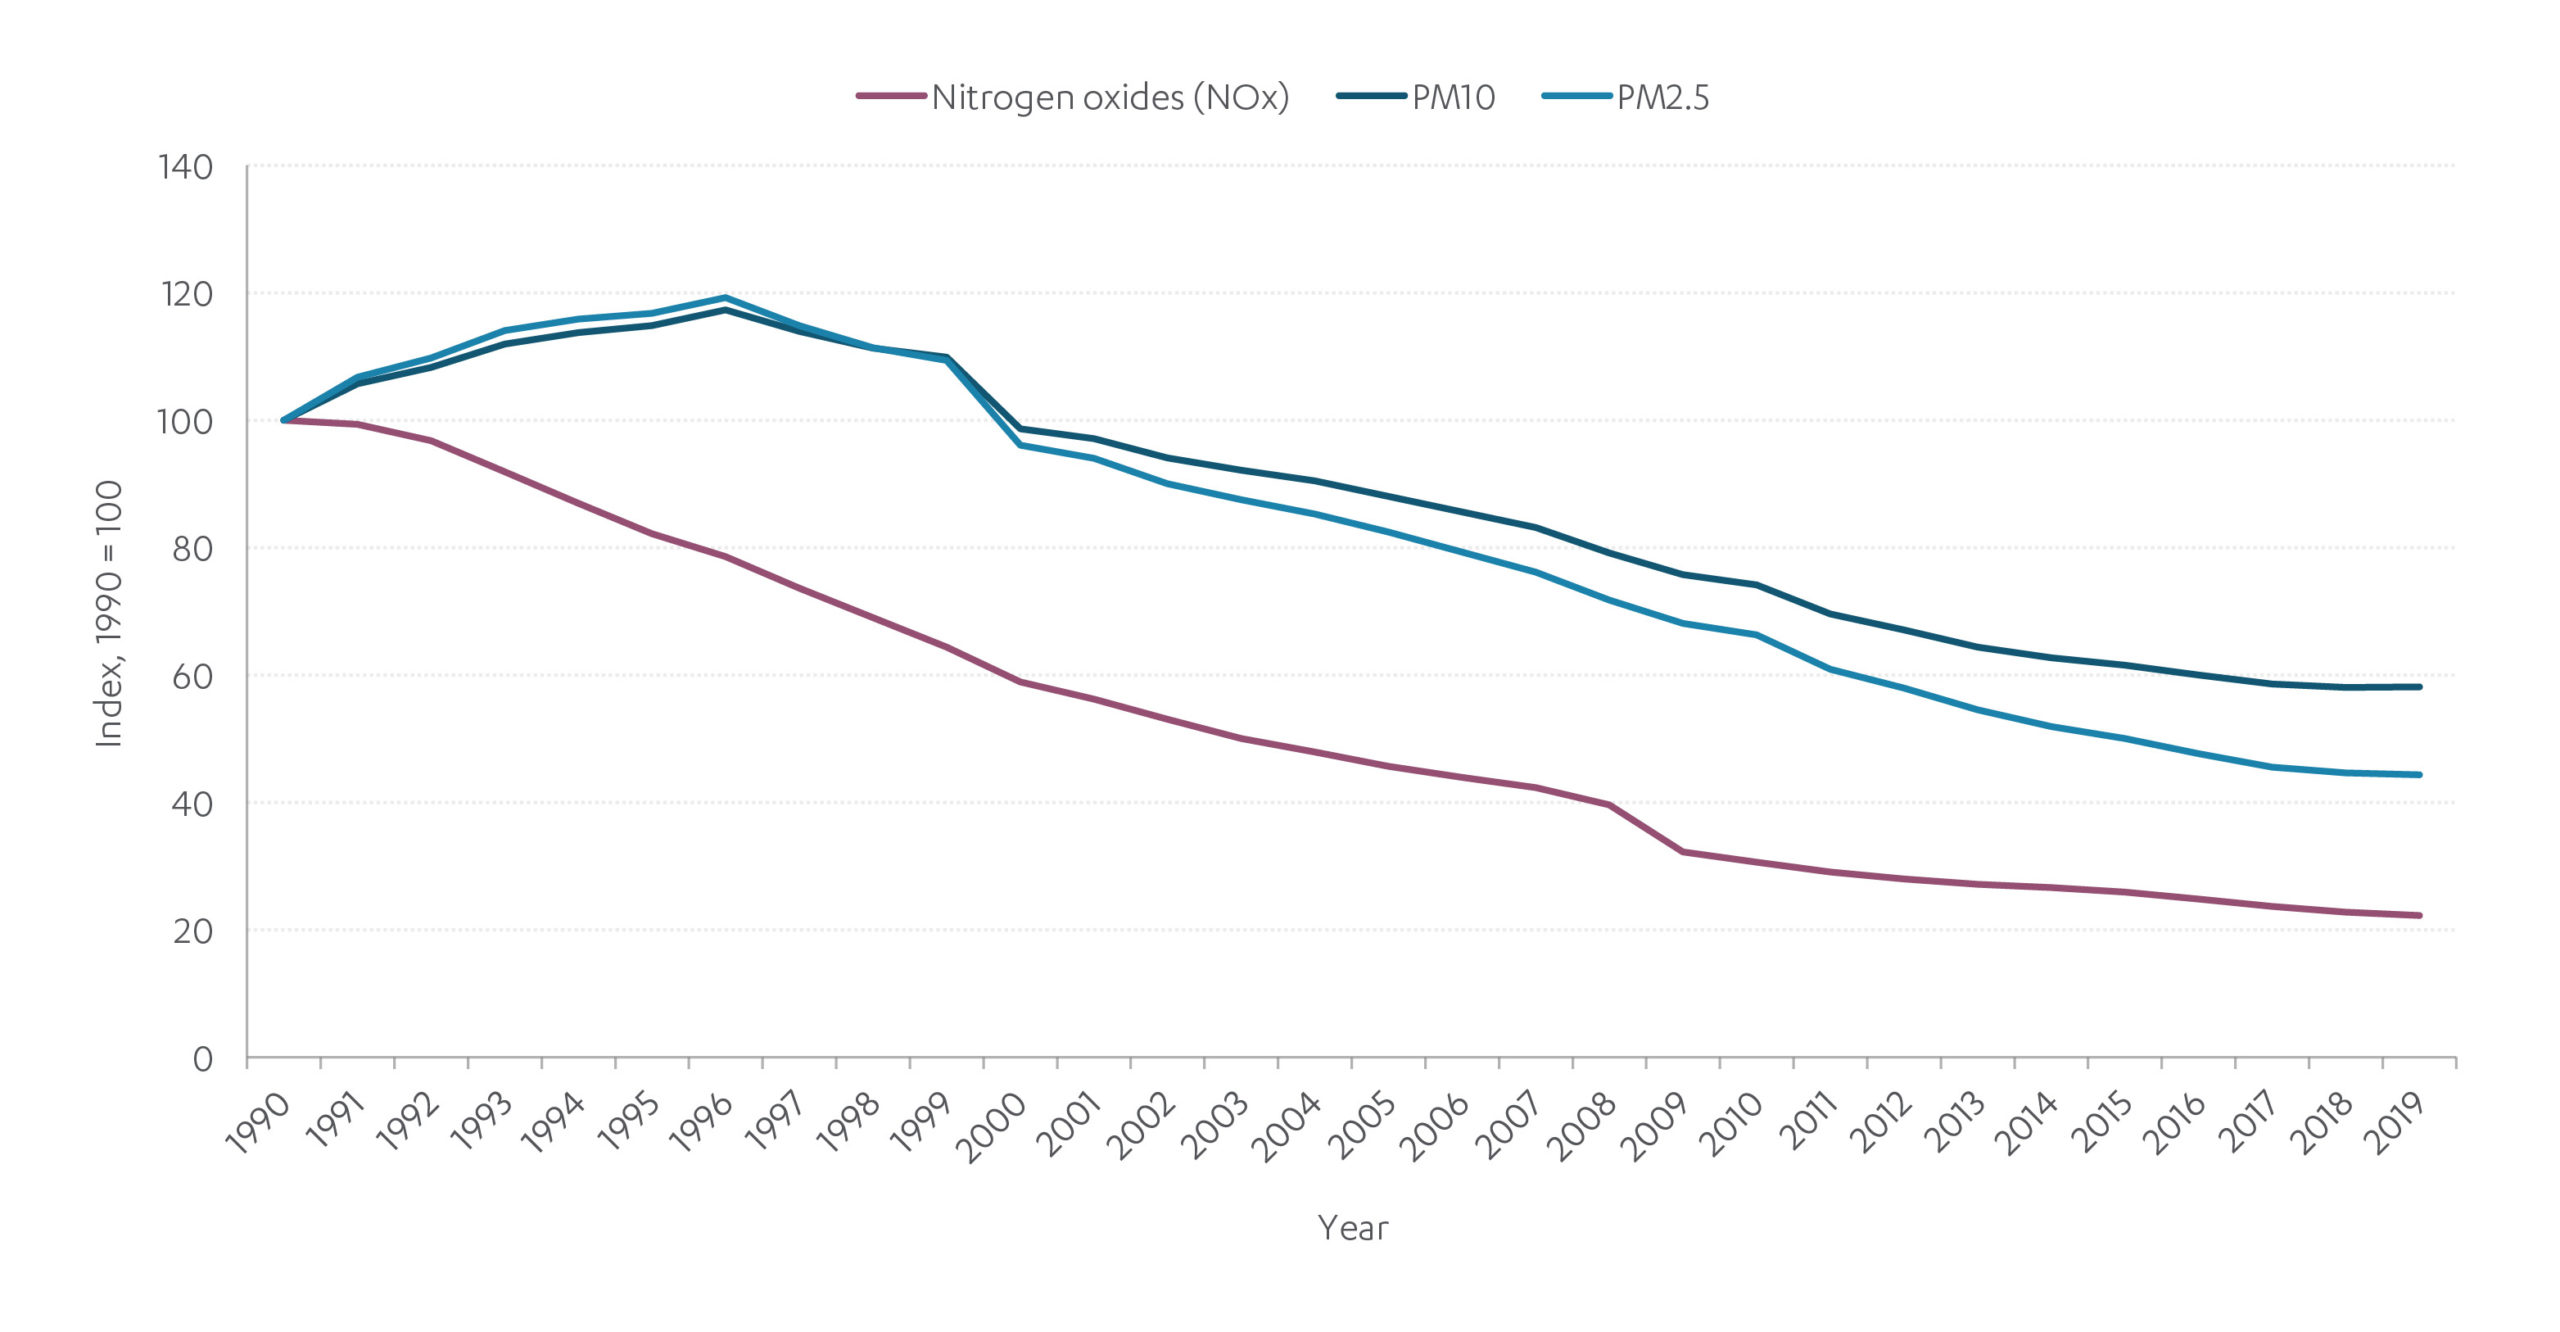
Source: Department for Transport (2021), Energy and environment: data tables (ENV)
Other environmental impacts
Transport generates noise and light pollution, which can be harmful to both quality of life and affect animal communication and behaviour.82 Roads and railways have negative impacts on biodiversity and habitats through construction, maintenance and operation. Impacts include habitat loss and fragmentation, isolation of populations and barriers to movement, mortality from vehicle collisions, stress from noise and visual stimuli, and the spreading of pests and diseases.83
Resilience
Transport services can become unavailable due to infrastructure failure or external events. Extreme weather is a significant risk for transport infrastructure and will be amplified by climate change. Failures can have serious consequences, especially on parts of the network which are intensively used or operating at capacity, or where places and their economies are dependent on a single route.84
National roads
Monitoring showed possible maintenance issues on four per cent of nationally managed motorways and seven per cent of national A roads in 2018-19.85 Maintenance requirements are dependent on the severity of winter weather with harsh winters leading to faster deterioration. The road environment contributed to 12 per cent of road traffic accidents in 2019.86
National roads are more physically resilient than in the past due to the relatively modern construction methods and design standards used, coupled with consistent and high levels of spending on maintenance.87 Some national roads are exposed to a significant risk of flooding, although incidents are relatively isolated.88 High winds and heavy rainfall can also cause disruption. Network outages can also be caused by accidents, or maintenance work.
Overall, road lanes are open for traffic more than 98 per cent of the time. Eighty-nine per cent of traffic incidents are cleared within one hour, although the number of incidents has increased by 38 per cent since 2015-16. The Office for Road and Rail does not monitor frequency or timeliness of planned or unplanned maintenance works, however, user satisfaction with roadworks improved from around 65 per cent to around 75 per cent in the two years to 2020.89
Only seven per cent of delays on national roads (excluding roadworks) were caused by bad weather, compared to 63 per cent from congestion, 14 per cent from accidents and ten per cent from breakdowns. Most delays are under 30 minutes.90
There were 25,945 serious injuries and 1,752 fatalities in reported road accidents in 2019. The number of road fatalities has seen a significant downward trend over the past 50 years, however this improvement has plateaued over the past decade.91 Nevertheless, injuries and fatalities on the road network are lower than in comparable countries.92 The rate of road deaths per million in 2019 was 27 for the UK, significantly lower than the EU average of 51.93
Local roads
For local roads, monitoring identified maintenance issues on three per cent of A roads, six per cent of B and C roads and 16 per cent of unclassified roads. Conditions have largely improved over the past decade, except for on unclassified roads where they have declined.94 The estimated cost of eliminating this backlog of local road maintenance was calculated in the first Assessment to be around £5 billion.95
It is not easy to compare the difference in impact of maintenance on urban, interurban or rural journeys. However, data on skidding resistance (one measure of road surface quality) suggests that network condition is significantly worse on London local roads, and slightly worse in other metropolitan authorities, than in other areas.96
There is no consistent data on the number and cause of failures to local roads. However, they are likely to be less resilient than national roads, as they are not designed to a recognised standard, the network is much larger and covers a wide range of microclimates, and there is greater variety in the type and capacity of local authorities responsible for maintenance.97 While spending on maintenance has increased over the past 20 years and the costs of maintenance may have fallen to some degree,98 there are concerns that local authorities lack the necessary funding to bring local roads up to a reasonable condition.99 Potholes are a visible example of resilience challenges, exacerbated by extreme weather and levels of traffic, and are a key concern for the public.100
Rail
For rail, composite measures of asset sustainability, which include condition and remaining life, declined by 0.1 per cent between the end of control period four (2014) and 2020-21 – representing a fall in the sustainability of rail assets. However, this is against a target of no more than a 1.6 per cent reduction in asset sustainability by 2024.101 The average age of rolling stock decreased from around 19 years to around 17 years between 2016-17 and 2019-20, as operators introduced new rolling stock.102
Rail is also vulnerable to extreme weather. Delays from high winds and adhesion are the costliest. Flooding and subsidence are less common but tend to have the highest cost per incident.103 Subsidence is a particular risk for rail due to age of earthworks and embankments, which were not designed to modern construction standards. Network Rail has strategies for climate adaptation and well established processes for asset management.104 However, there have been several major failures caused by extreme weather in recent years including at Dawlish, Harbury, Watford and Carmont.105
Figure F.12: Rail cancellations are more likely to arise from train or infrastructure faults than external events such as weather
Number of rail cancellations (total and split between causes linked to infrastructure and train operations or external events), 2014-2021
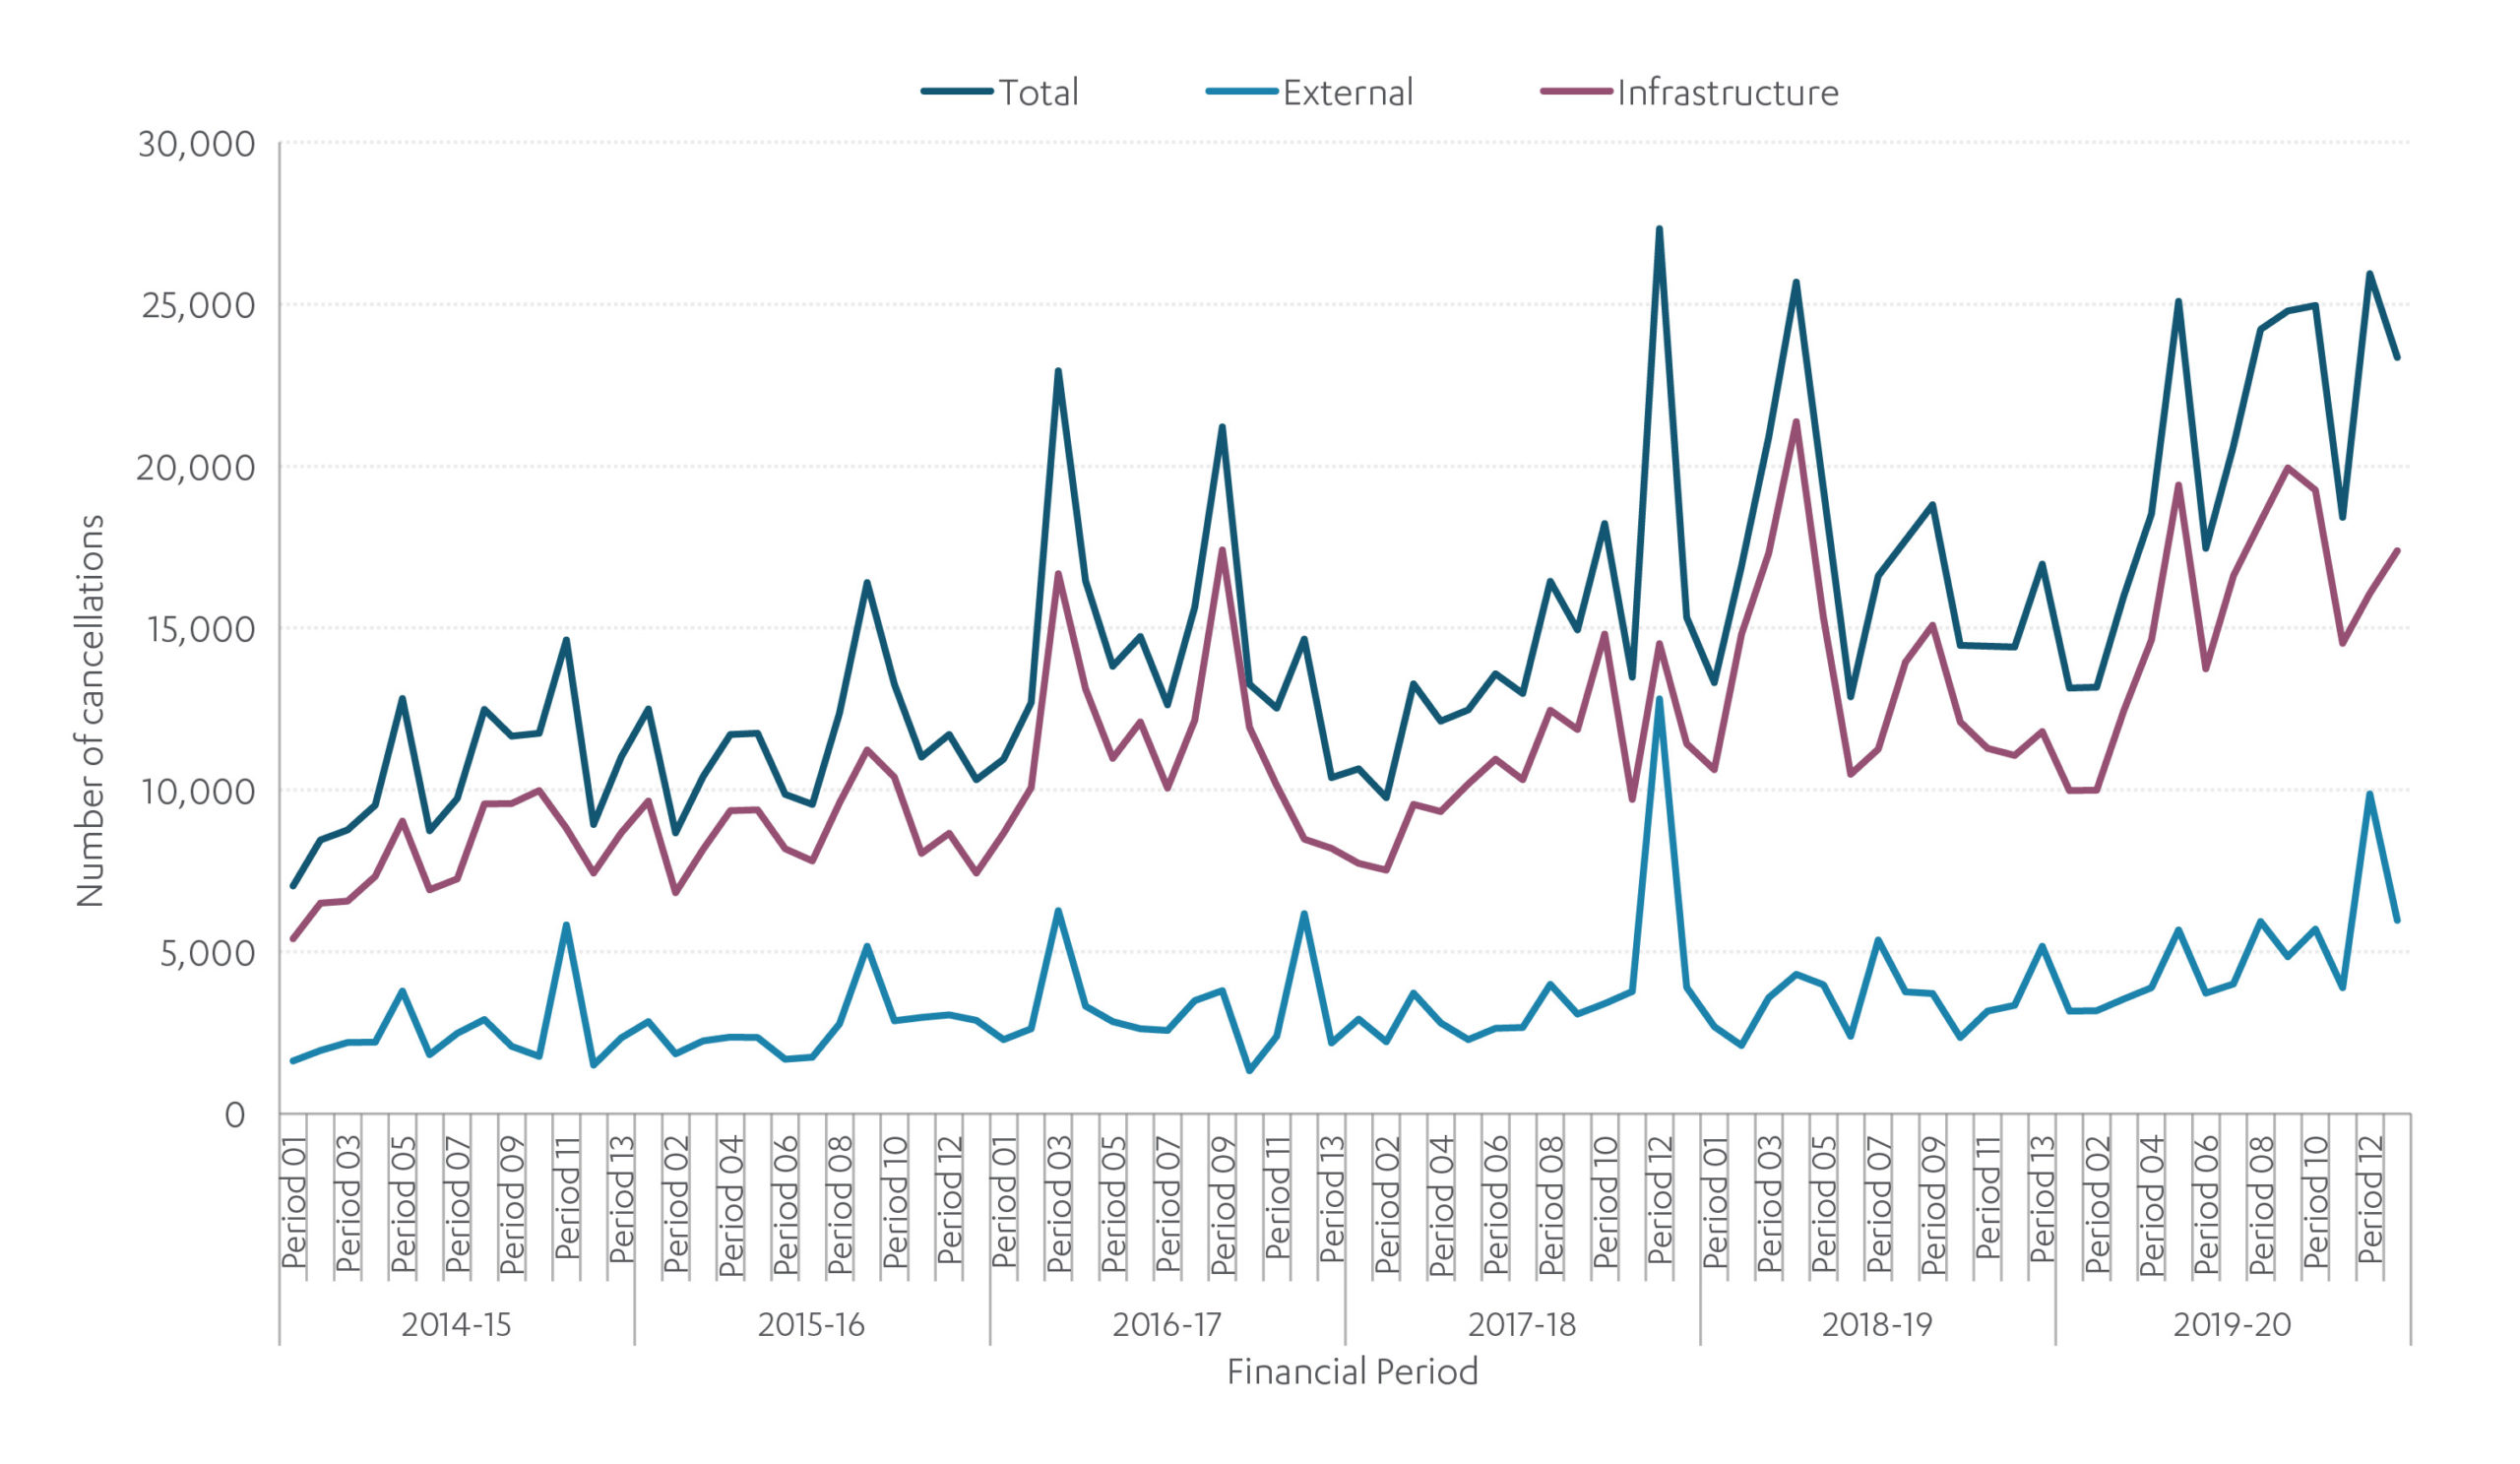
Source: Office for Road and Rail (2021), Passenger Rail Performance
In 2019-20 there were 12 fatalities on trains or in stations, down from 17 in 2018-19. The trend over the past decade has been relatively stable with an average of six fatalities per year between 2007-8 and 2019-20.106
Next Section: Looking ahead
Investment in transport infrastructure will continue to play an important role in improving regional productivity and helping the government achieve its ambition of levelling up outcomes between and within regions.
Looking ahead
Investment in transport infrastructure will continue to play an important role in improving regional productivity and helping the government achieve its ambition of levelling up outcomes between and within regions.
Investment will also need to support the government’s net zero aim, with transport now the biggest contributor of greenhouse gases by sector.107
Urban transport
England’s largest cities – those with a population above 500,000 – tend to be more congested leading to poorer transport connectivity.108 This can limit growth in these cities and reduce the quality of life for residents. Increasing public transport connectivity through major capacity upgrades – such as a metro system or bus rapid transit – is one solution for cities where better connectivity could enable growth, which the Commission recommended in the first Assessment. Demand management measures, including congestion charging, may offer an alternative or complementary way to improve connectivity. The Commission will consider these solutions further in the second Assessment.
Transport investment will need to be adaptable to the range of scenarios which are plausible outcomes as a result of long term behavioural change following the Covid 19 pandemic. The Commission identified likely scenarios in Behaviour change and infrastructure beyond Covid-19. Congestion in large cities fell initially during the Covid 19 pandemic but has returned to high levels and there remains scope for longer term changes. Demand for urban travel could decrease if people move away from cities, in other scenarios congestion could remain high or get worse.
The Climate Change Committee has said that to meet the sixth Carbon Budget, the government will need to rely on a combination of zero emission vehicles replacing the current fleet and modal shift towards public transport and active travel.109 The government’s Net Zero Strategy reiterated its plan to end the sale of petrol and diesel vehicles by 2030, and hybrid vehicles by 2035.110 These targets will need to be accompanied by a widespread rollout of electric vehicle charging points. It is forecast that between 280,000 and 480,000 public charging points will be required to support the 2030 target; there were around 24,300 charging points in July 2021, mostly located in London and urban areas in the South East.111 Given the current support levels for electric vehicles, the transition to zero emission vehicles will also have a potentially significant fiscal impact. The government said in its Net Zero Strategy that it would publish an electric vehicle infrastructure strategy later this year.112
Interurban transport
There are wide variations in interurban connectivity across England. Improving interurban connectivity can facilitate trade between cities and make places more attractive to live and work in.
Achieving net zero will require further investment and change in interurban transport. The government’s Transport Decarbonisation Strategy set out the aim to remove all diesel only trains from the railway network by 2040, and to deploy low carbon technologies on the network such as hydrogen and battery trains where they make operational and economic sense.113
Technological change may also lead to changes in the way transport networks are used. Autonomous vehicles and on demand shared mobility services could enable different travel opportunities, with safer and faster car journeys making road travel more attractive for longer distance trips, and users who cannot themselves drive being able to travel by car alone.
The government is investing substantially in interurban transport through projects such as High Speed 2 and the second Road Investment Strategy. An integrated rail plan, informed by the Commission’s Rail Needs Assessment for the Midlands and the North, is also expected soon. A multi modal transport strategy for interurban connectivity would help ensure that investments like these are planned together effectively, optimising the use of different modes and considering the needs of passenger and freight travel together.
Aviation and maritime
The Climate Change Committee has said that aviation emissions need to reduce by around 17 per cent and maritime by 94 per cent compared to 2017 to meet net zero.114 The government needs to put in place appropriate measures to ensure this can be achieved, which the Climate Change Committee anticipates will include limiting aviation demand growth to 25 per cent above 2018 levels.115
Infrastructure capacity at ports and airports is managed through private sector investment, with government oversight through the planning system. Although airports can have an impact on economic outcomes – they facilitate global trade, provide jobs, and can be globally significant assets – any consideration of aviation is dependent on future demand for air travel following the Covid 19 pandemic, and the approach to expanding runway capacity in the South East, which is currently unclear. The second Assessment will therefore not consider airport capacity, although interurban connectivity to international gateways will be included.
Next Section: Challenges and opportunities
The second Assessment will carry out new analysis and develop recommendations on three key challenges that will affect the transport sector:
Challenges and opportunities
The second Assessment will carry out new analysis and develop recommendations on three key challenges that will affect the transport sector:
Challenge 5: Asset management and resilience – The Commission will consider how asset management can support resilience, barriers to investment, and the use of data and technology to improve the way assets are maintained.
Challenge 8: Urban mobility and congestion – The Commission will examine how the development of at scale mass transit systems can support productivity in cities and city regions and consider the role of congestion charging and other demand management measures.
Challenge 9: Interurban transport across modes – The Commission will consider relative priorities and long term investment needs, including the role of new technologies, as part of a strategic multimodal transport plan.
References
- Department for Transport (2020), Average number of trips (trip rates) by purpose and main mode: England 2019
- Department for Transport (2019), Domestic freight transport by mode
- Department for Transport (2021), Road lengths in Great Britain: 2020; Office of Rail and Road (2020), Rail infrastructure and assets 2019-20
- Department for Transport (2021), National Travel Survey: Mode of Travel
- Department for Transport (2020), Modal comparisons: Passenger transport
- Department for Transport (2020), Transport Statistics Great Britain 2020 Data is not disaggregated by country
- National Infrastructure Commission (2021), Behaviour change and infrastructure beyond Covid-19
- HM Treasury (2020), Whole of Government Accounts: year ended 31 March 2019. Figures include all rail and road assets in Great Britain, as the data is not further disaggregated in Government accounts.
- Department for Transport (2021), Transport and Environment Statistics 2021: Annual Report
- National Infrastructure Commission (2020), Growth across regions
- Asphalt Industry Alliance (2021), Annual Local Authority Road Maintenance Survey 2021
- Government Office for Science (2018), The history of transport systems in the UK
- Government Office for Science (2018), Urban form and infrastructure: a morphological review
- National Infrastructure Commission (2021), Historic transport datasets
- Government Office for Science (2018), Urban form and infrastructure: a morphological review
- Greater London Authority (2021), London’s Population
- Office for Road and Rail (2021), Passenger journeys; Transport for London (2009), Key trends and developments Report number 1
- Commission on Travel Demand (2018), All Change: The future of travel demand and the implications for policy and planning; Department for Transport (2019), National Travel Survey
- Department for Transport (2021), Transport and Environment Statistics 2021: Annual Report
- Office of Rail and Road (2021), Our Functions; Department for Transport (2021), About us; UK Civil Aviation Authority (2021), Our role
- Driver and Vehicle Standards Agency (2021), About us
- Ofgem (2021), Who we are
- National Highways (2021), Our roads
- UK Government (1985), Transport Act 1985, Section 63(1)(a)
- Transport for London (2021), Congestion Charge; Durham City Council (2021), Durham Peninsula charging zone; Nottingham City Council (2021), Workplace Parking Levy
- Urban Transport Group (2021), Who does what on transport?
- Local Government Association (2021), Devolution explained
- Transport for London (2021), How we are governed
- Network Rail (2021), How we’re governed and managed; National Highways (2021), Our roads
- National Highways (2021), Our roads
- Network Rail (2021), How we’re governed and managed
- National Audit Office (2021), A financial overview of the rail system in England
- Department for Transport (2020), Rail franchising reaches the terminus as a new railway takes shape
- UK Government (2016), Cities and Local Government Devolution Act 2016
- Transport for the North (2021), Economic growth
- Peninsula Transport (2021), Our vision
- National Infrastructure Commission (2019), Better delivery: the challenge for freight
- Government Office for Science, Foresight (2019), Governance of UK Transport Infrastructure: Technical Annex
- For example, Network Rail and Highways England (2021), The Solent to the Midlands Multimodal Freight Strategy
- British Ports Association (2021), UK Ports Industry
- Government Office for Science, Foresight (2019), Governance of UK Transport Infrastructure: Technical Annex
- Government Office for Science (2019), Governance of UK Transport Infrastructures: Technical Annex
- Government Office for Science, Foresight (2019), Governance of UK Transport Infrastructure: Technical Annex
- NATS (2021), Our history; Civil Aviation Authority (2021), How air traffic control works
- Civil Aviation Authority (2020), Airport Data
- Budd and Ison (2021), Public utility or private asset? The evolution of UK airport ownership
- UK Parliament (2020), Funding roads: Coming full circle?
- UK Parliament (2019), Local roads funding and maintenance: filling the gap
- Office for Budget Responsibility (2021), Economic and Fiscal Outlook: October 2021
- House of Commons (2019), Bus services in England outside London
- Department for Transport (2021), A financial overview of the rail system in England
- Department for Transport (2013), Energy and environment: TSGB0303 (ENV0103): Average new car fuel consumption
- Office for Road and Rail (2021), Passenger journeys
- Department for Transport (2021), Transport use during the coronavirus (COVID-19) pandemic
- Secretary of State for Transport (2020), Contingency Fund: Written Ministerial Statement to Parliament
- UK Parliament (2019), Local roads funding and maintenance: filling the gap
- Department for Transport (2021), A financial overview of the rail system in England
- Office for Road and Rail (2021), Our Functions
- Infrastructure Projects Authority (2019), Private Finance Initiative and Private Finance 2 projects: 2018 summary data
- National Infrastructure Commission (2019), Transport Connectivity: Discussion Paper
- National Audit Office (2020), Improving local bus services in England outside London
- National Infrastructure Commission (2020), Rail Needs Assessment for the Midlands and the North p.28
- Office for National Statistics (2018), Percentage of households with cars by income group, tenure and household composition: Table A47
- NatCen Social Research (2019), Transport and inequality: An evidence review for the Department for Transport
- Department for Transport (2020), National Travel Survey: Average number of trips (trip rates) by age, gender and main mode (using 2019 data to reflect pre-pandemic patterns)
- Transport Focus (2020), National Rail Passenger Survey; Transport Focus (2019), Bus Passenger Survey; Transport Focus (2020), Strategic Roads User Survey
- Transport Focus (2019), National Rail Passenger Survey
- Transport Focus (2019), Bus Passenger Survey
- Ipsos Mori (2010), National Infrastructure Commission Phase 2: public research; PwC (2021), NIA2 Social Research Final report
- Department for Transport (2020), Concessionary passenger journeys on local bus services by metropolitan area status and country: Great Britain, annual. Fare calculation based upon Department for Transport (2020), Passenger journeys on local bus services by metropolitan area status and country: Great Britain, annual from 1970 and Department for Transport (2020), Estimated operating revenue1 (at current prices2) for local bus services by revenue type and metropolitan area status: England, annual from 2004/05
- Department for Transport (2020), Concessionary passenger journeys on local bus services by metropolitan area status and country: Great Britain, annual. Fare calculation based upon Department for Transport (2020), Passenger journeys on local bus services by metropolitan area status and country: Great Britain, annual from 1970 and Department for Transport (2020), Estimated operating revenue1 (at current prices2) for local bus services by revenue type and metropolitan area status: England, annual from 2004/05
- Department for Business, Energy and Industrial Strategy (2021), 2019 UK greenhouse gas emissions: final figures
- Department for Business, Energy and Industrial Strategy (2021), 2019 UK greenhouse gas emissions: final figures
- Society of Motor Manufacturers and Traders (2019), New Car CO2 Report 2019
- Committee on Climate Change (2021), The Sixth Carbon Budget: Surface Transport
- Department for Transport (2017), https://www.gov.uk/government/statistics/national-travel-survey-2017 NTS 0309 2017 is the latest year this data was published
- Climate Change Committee (2020), The Sixth Carbon Budget Aviation, p 5
- Department for Business, Energy and Industrial Strategy (2021), 2019 UK greenhouse gas emissions: final figures
- Department for Transport (2020), ENV0301: Air pollutant emissions by transport mode: United Kingdom
- European Commission (2016), Car emissions: Commission opens infringement procedures against 7 Member States for breach of EU rules
- Office for National Statistics (2019), Road transport and air emissions
- The Royal Society (2013), An experimental investigation into the effects of traffic noise on distributions of birds: avoiding the phantom road
- European Commission (2003), The European Review: COST Action 341 Habitat fragmentation due to transportation infrastructure
- Department for Transport (2014), Transport Resilience Review: A review of the resilience of the transport network to extreme weather events
- Department for Transport (2019) Road Conditions in England to March 2019
- Department for Transport (2019), Contributory factors: Reported accidents by English region and country, Great Britain, 2019
- Department for Transport (2014), Transport Resilience Review
- Hankin et al (2016), Flood Risk to the Strategic Road Network in England
- Office of Road and Rail (2020), Annual Assessment of Highways England: End of Road Period 1: 2015-2020
- Transport Focus (2021), Transport Focus NTS Data, Strategic roads user survey, advanced analysis, delays other than roadworks
- Department for Transport (2021), RAS40001. Reported accidents and casualties, population, vehicle population, index of vehicle mileage, by road user type and severity, Great Britain, 1926 – 2020; Department for Transport (2020), Reported road casualties in Great Britain: 2019 annual report
- Department for Transport (2019), RAS52001. International comparisons of road deaths: number and rates for different road users
- European Commission (2020), 2019 road safety statistics; European Union Agency for Railways (2020), Report on Railway Safety and Interoperability in the EU; European Commission (2021), Road safety: 4,000 fewer people lost their lives on EU roads in 2020 as death rate falls to all-time low; Department for Transport (2020), Reported road casualties in Great Britain: 2019 annual report
- Department for Transport (2019), Road Conditions in England to March 2019
- National Infrastructure Commission (2018), National Infrastructure Assessment
- Department for Transport (2019), Skidding resistance of principal roads1, in England, three year averages from 2013/14 to 2018/19
- Department for Transport (2014), Transport Resilience Review: A review of the resilience of the transport network to extreme weather events
- House of Commons Transport Committee (2019), Local roads funding and maintenance: filling the gap p 12
- House of Commons Transport Committee (2019), Local roads funding and maintenance: filling the gap
- PwC (2021), NIA2 Social Research Final Report
- Office of Rail and Road (2020), Annual Assessment of Network Rail: April 2020 to March 2021
- Office of Rail and Road (2020), Rail Infrastructure and Assets 2019/20
- Network Rail (2017), Weather Resilience and Climate Change Adaptation Strategy 2017-19
- Department for Transport (2014), Transport Resilience Review: A review of the resilience of the transport network to extreme weather events; David Jaroszweski, Ruth Wood & Lee Chapman (2021), Infrastructure. In: The Third UK Climate Change Risk Assessment Technical Report, prepared for the Climate Change Committee
- Network Rail (2019), Five years since we reopened Dawlish
- Office of Road and Rail (2020), Rail Safety 2019-20
- Department for Transport (2021), Decarbonising Transport
- See chapter 4.
- Climate Change Committee (2020), Sixth Carbon Budget
- HM Government (2021), Net Zero Strategy: Build Back Greener
- Competition and Markets Authority (2021), Electric vehicle charging market study: final report
- HM Government (2021), Net Zero Strategy: Build Back Greener
- Department for Transport (2021), Decarbonising Transport
- Committee on Climate Change (2019), Net Zero Technical report
- Committee on Climate Change (2019), Net-zero and the approach to international aviation and shipping emissions
Status: Completed
Second National Infrastructure Assessment: Baseline Report
An analysis of the current state of key infrastructure sectors
Reports & StudiesDesign & Funding Digital & Data Energy & Net Zero Environment National Infrastructure Assessment Place Regulation & Resilience Transport Water & Floods
Latest Updates

Coming up in 2024
This page shows a calendar reflecting the latest expected dates for Commission reports, publications and events. You can also sign up to receive our quarterly newsletter by entering your email address in the box at the foot of each website page.
Charge point access remains key to expanding EV rollout
In the first National Infrastructure Assessment, the Commission made a number of recommendations about the rollout of Electric Vehicle (EVs) chargepoints, including prioritising a national rapid-charging network, allocating more local authority parking spaces for charging, and investing in a smarter electricity network. Around the same time, the Government’s Centre for Connected and Autonomous Vehicles (CCAV)...