Baseline Report Annex D: Water and wastewater
Analysis of the country's water and wastewater infrastructure which informs the Baseline Report for the second National Infrastructure Assessment.
Tagged: Water & Floods
Sector overview
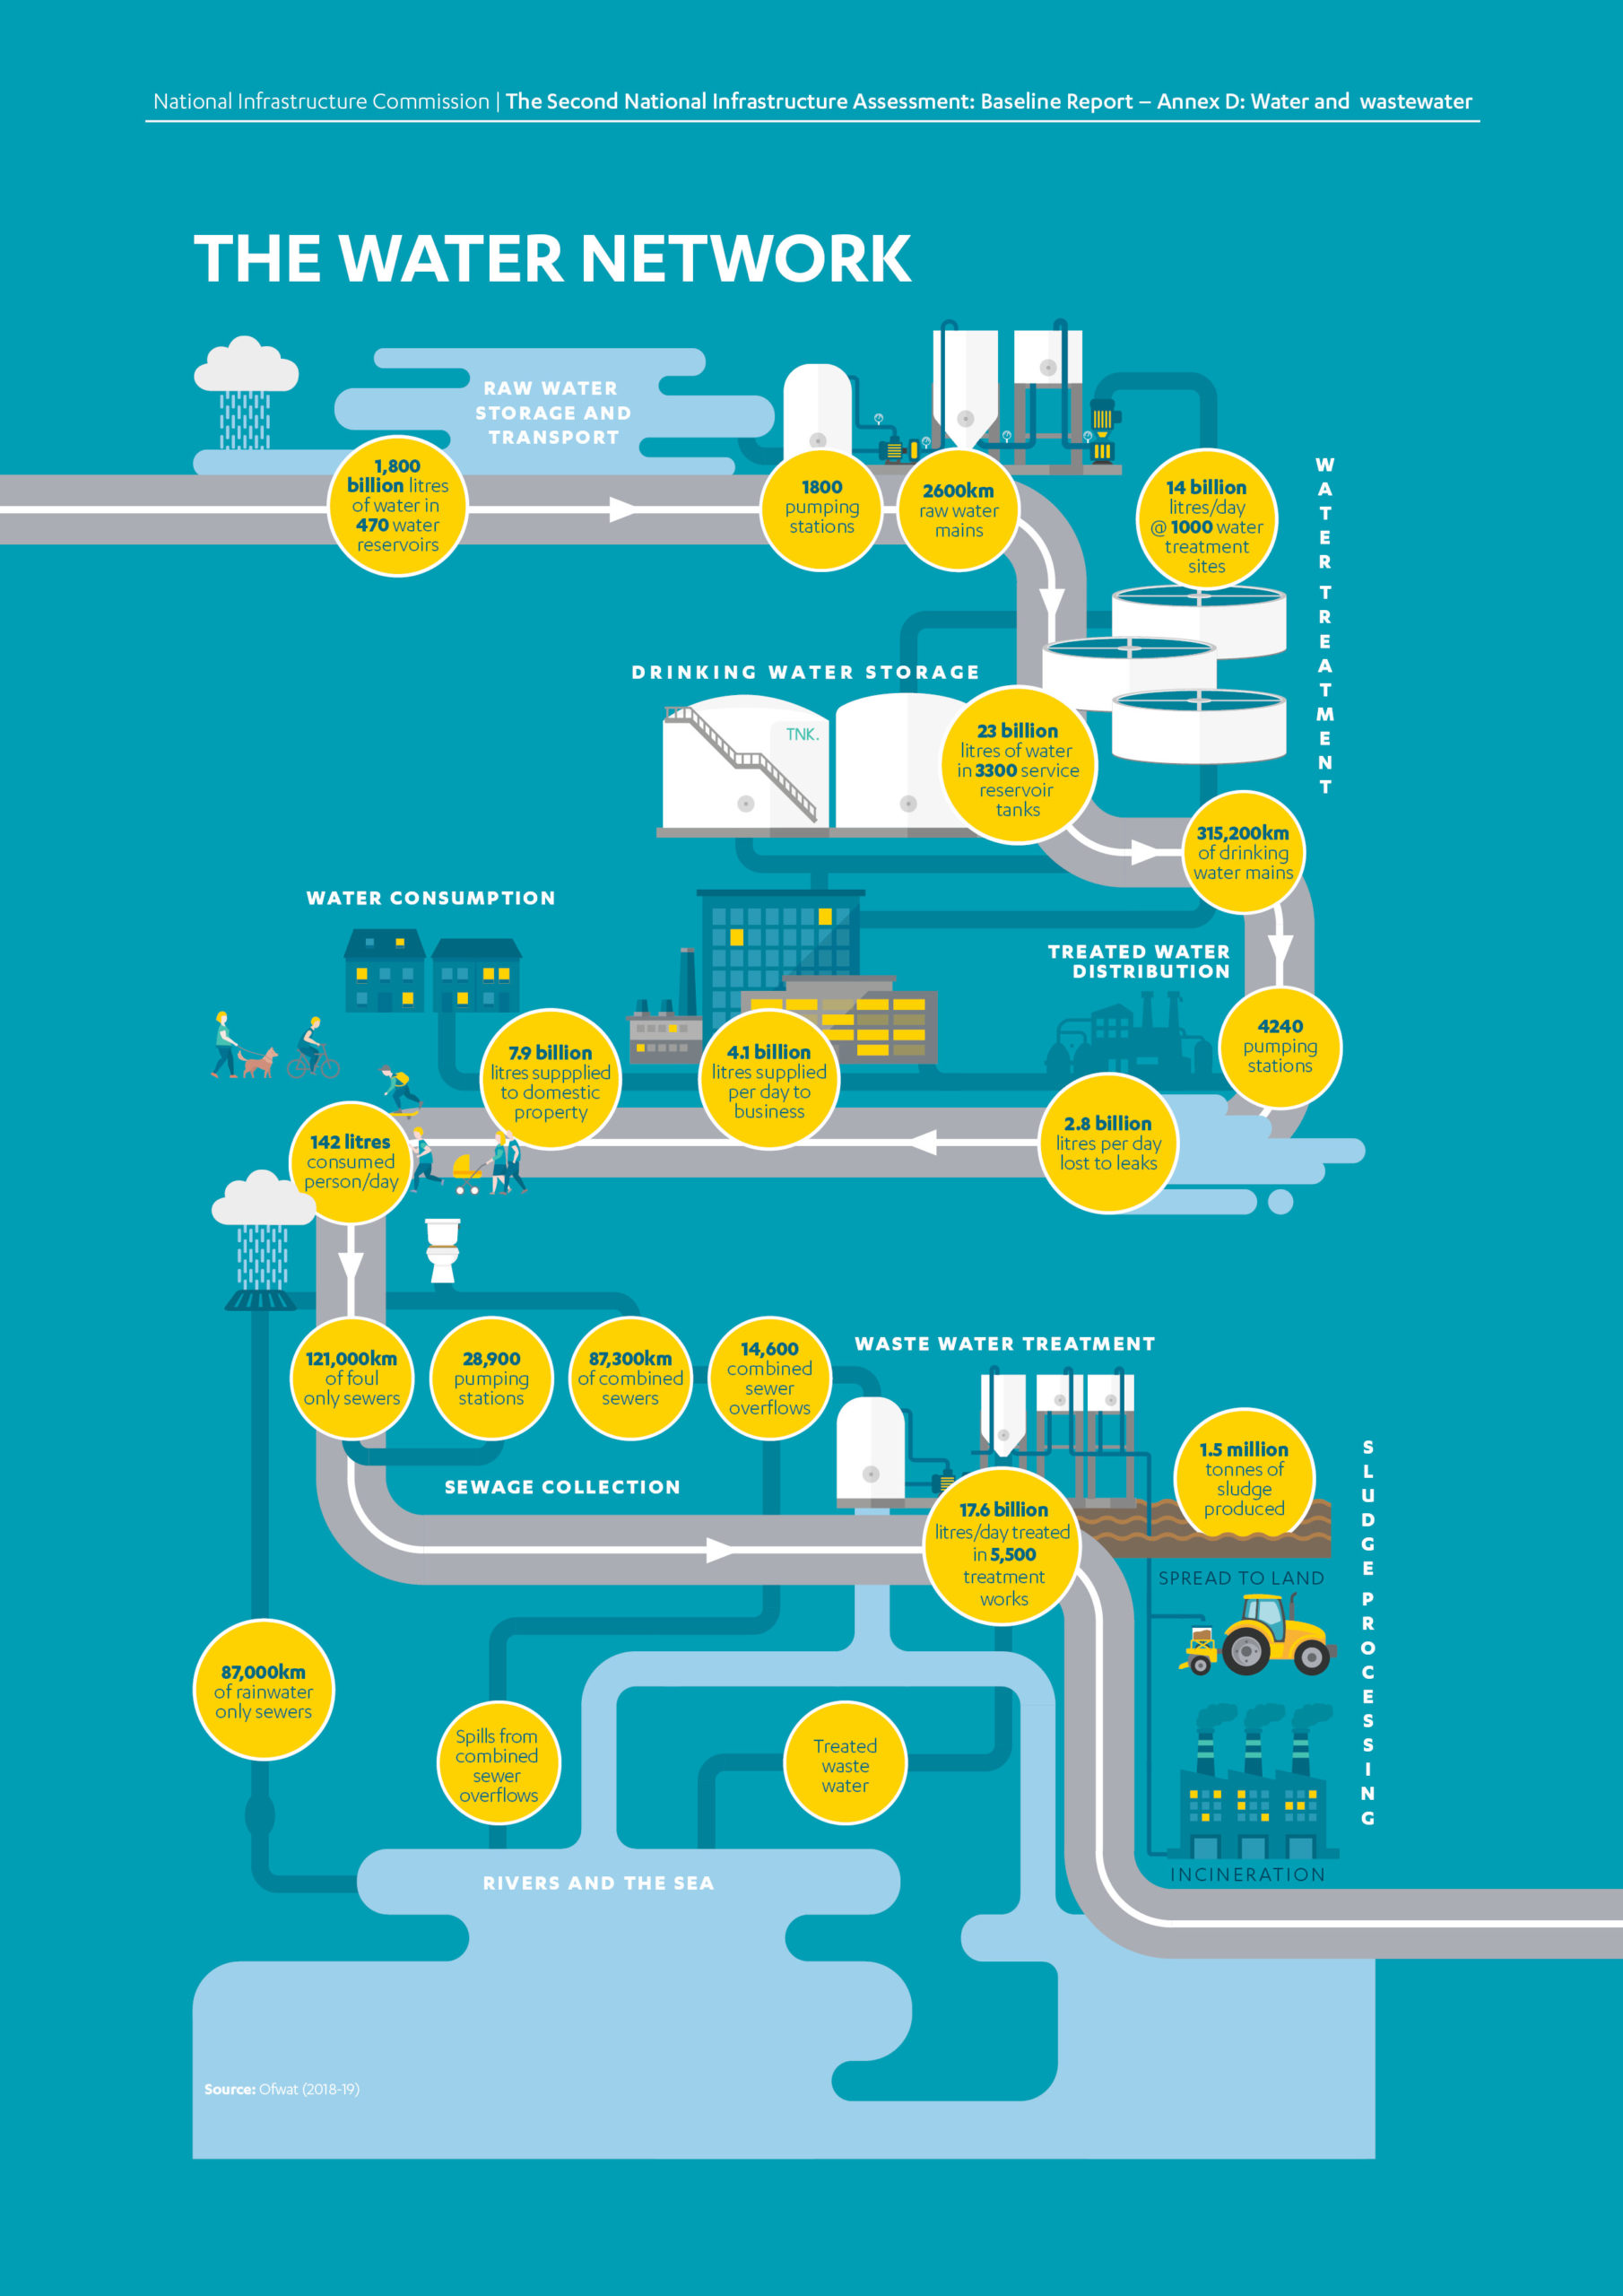
Water networks supply clean drinking water to properties. Clean water infrastructure consists of water abstraction sites, transfer pipes, distribution networks, pumps, water treatment sites and storage facilities for raw and treated water. Water supply is essential for society and the economy.
Wastewater services protect public health and the environment. Wastewater networks collect and transport surface water, sewage, or a mixture of both. Sewage is transported for treatment at sewage works. Wastewater infrastructure includes sewer pipes, pumps, storage tanks, treatment works and other assets that enable the operation of networks, as well as green infrastructure, such as sustainable drainage systems for surface water, which slow and control flows. This helps to avoid overwhelming systems and can reduce pollution entering water courses.
This annex focuses on public water supply which involves the largest water and wastewater infrastructure.
Water and wastewater infrastructure is capital intensive and has a long life. In 2019-20, the regulated capital value of the English water assets stood at £30 billion. For wastewater assets the value was £39 billion.1 Regulatory capital value represents the value of water and wastewater companies’ assets that is regulated by Ofwat.
Water use
About a third of all water taken from the environment is used for public water supplies provided by water companies.2 This is equivalent to almost 14,600 million litres per day taken for public water supply out of a total of around 44,660 million litres.3 The remainder is used for a range of other purposes, including cooling power stations and irrigation. Out of the public supply needs, more than a quarter is used by non-households, amounting to approximately 4,110 million litres.4 In terms of domestic consumption, on average, a person in England consumes 142 litres of water per day5 compared to a European average of 128 litres per person per day.6 Roughly a third of water for public supply comes from groundwater.7 This is fresh water which has collected underground in spaces in soil, sand and rock. The remaining two thirds comes from surface water sources such as lakes, rivers and reservoirs.
Water and wastewater and the Commission’s remit
The Commission’s remit covers the supply of water and wastewater services to the public, and other sectors such as agriculture, energy and food processing. Responsibility for water and wastewater policy is devolved to the governments of Scotland, Wales and Northern Ireland. The Commission’s remit covers England only. However, some data presented in this annex will cover England and Wales jointly, as the same body provides economic regulation for both countries. Where this is the case, appropriate references will be made to clarify the data split.
Next Section: Governance and regulation
The sector was fully privatised in 1989 under the Water Industry Act. English water and wastewater infrastructure is owned and run by regional monopolies.
Governance and regulation
The sector was fully privatised in 1989 under the Water Industry Act. English water and wastewater infrastructure is owned and run by regional monopolies.
There are nine water and wastewater companies and ten companies supplying only water.8 In addition, there are a number of smaller water and wastewater companies serving very local areas, such as new housing developments. There is also one licenced ‘infrastructure provider’ responsible for financing, building, maintaining, and operating the Thames Tideway Tunnel which is a major new part of London’s sewerage system.9
Box D.1: The history of the water and wastewater sector
Widespread access to piped water supply began in the late 18th century and was followed by extensive sewer building works some years later.10 The industry developed gradually to meet the needs of a growing population, and by the early 20th century most people had water and sewerage services. This piecemeal development meant the industry was highly fragmented even after the Second World War. There were more than 1,000 bodies responsible for water supply and around 1,400 bodies taking care of sewerage networks.11 Most often these were local authorities but there were also several statutory local private water companies.
In the late 1960s and early 1970s the problems of localised water management resulted in restructuring of the industry and the creation of ten new regional water authorities as part of the Water Act 1973.12 The new authorities took over local authorities’ responsibilities for water and sewerage services but not for other drainage (such as highways), however there were still challenges in meeting investment needs through government funding and charges raised alone.13
The sector was privatised as part of the 1989 Water Act. To protect the interests of consumers and the environment, separate bodies were established at the same time for economic, quality and environmental regulation of the sector.14
The water industry is ‘vertically integrated’, meaning households must purchase their water and wastewater services from the regional monopoly provider. This means governance and regulation of the sector are important in ensuring quality and price do not suffer from the lack of competition.15 Since 2017, businesses have had a choice in who they pay for their water and wastewater service, with new retail service providers entering the market.16 However, the water and sewerage infrastructure itself is still provided by the regional monopolies.
In England the Department for Environment Food and Rural Affairs is responsible for the overall policy framework. This is set through legislation and guidance. The sector has four key regulators:
- Ofwat is the economic regulator for the water sector in England and in Wales. It is responsible for making sure water companies properly carry out and finance their functions, and for protecting consumers’ interests. It controls the revenue water companies can collect and the levels of service they provide. This is largely achieved through its five yearly price review process.
- The Environment Agency is the environmental regulator. It decides how much water can be taken from the environment via abstraction licencing and enforces quality standards on treated wastewater when it is returned to rivers and the sea.
- The Drinking Water Inspectorate ensures that water supplied by companies is safe to drink.
- The Consumer Council for Water represents consumers and investigates complaints that have not been resolved by water companies.
As well as collecting sewage, water and wastewater companies provide drainage services for properties. This includes rainwater runoff from roofs, patios and paved areas. However, responsibility for draining land does not just sit with the water and wastewater companies. It is shared across a range of other public and private bodies including property owners, Lead Local Flood Authorities, highways authorities, landowners and Internal Drainage Boards.17 Further detail can be found in Annex C: Flood resilience.
Government has published its draft Strategic Policy Statement,18 setting out its objectives for the water and wastewater sector in the next price review period. This must be taken into account by Ofwat during its price review. The draft statement focused on key areas such as protecting and enhancing the environment, increasing the resilience of the water sector, protecting vulnerable customers and improving services as well as driving the uptake of market based tools that increase competition. Ofwat has started the process of preparing for its next price review in 2024 which will cover the period 2025 to 2030. It set out its initial views and invited comments in PR24 and beyond: Creating tomorrow, together’.19
Box D.2: Governance and regulation in the devolved nations
Wales
Water and sewerage services in Wales are largely devolved. The Welsh Government sets the policy framework in Wales including legislation and standards.20 It also sets out strategic priorities that it expects Ofwat to pursue in its regulation of the water industry in Wales. Ofwat is the economic regulator for England and Wales, and Wales also shares the consumer champion, CCW with England. Wales has independent environment and quality regulators.21 The majority of water and sewerage services are provided by two water and sewerage companies, Dwr Cymru (Welsh Water) and Hafren Dyfrdwy (HD Cymru). Dwr Cymru is a not for profit company providing services to most of Wales and Herefordshire in England.22 Wales has a limited framework for competition for business customers.23
Scotland
Scotland’s water and sewerage services are devolved. They are provided by Scottish Water which is owned by the Scottish government.24 The Scottish Government produces its own legislation in relation to water and environment.25 Scotland has its own independent economic, quality and environment regulators and customer champion.26 Scotland’s water sector has a framework for competition.27 Business customers (all non domestic customers) can choose their supplier.
Northern Ireland
Water and sewerage policy is devolved and services are provided by Northern Ireland Water, a government owned company set up in April 2007. The company is owned by the Northern Ireland Executive, and its sole sponsor is Northern Ireland’s Department for Infrastructure. Only non domestic customers pay water charges to the company. Northern Ireland Water receives a subsidy from the Department for Infrastructure, in lieu of domestic consumer contributions, to fund its operations and investment. Northern Ireland has independent economic, quality and environment regulators and an independent customer champion. There is no market competition in the country.28
Funding and financing
Funding
English water and wastewater infrastructure and services are funded by customers’ bills. The water and wastewater industry have 22.3 million domestic customers29 and 1.2 million non domestic customers in England30.
Ofwat sets the amount of money that each water and wastewater company can collect through customers’ bills. The total revenue of the industry averages approximately £12.1 billion per year in real terms for the 2020-2025 period, totalling almost £61 billion overall, and is modestly lower than total revenue during the previous 5 years.31 Details on prices and changes over time to water and sewerage bills can be found in section D.4.
Financing
In England, improvements to water company services are financed through private investment.32 Water and wastewater infrastructure requires significant investment to maintain and enhance the level of service it provides. Companies issue debt or raise equity to finance projects so they can make investments that are paid off by future years’ revenue. Investment in water and wastewater infrastructure brings long term benefits to customers considering the long operational life of water industry assets. This approach also limits frequent changes to customers’ bills. In return, investors require a return on finance, which customers pay over a long period.
Since privatisation, companies have significantly increased financing the regulatory capital value through debt, whilst financing through equity has remained at a relatively similar level.33 Regulatory capital value represents the value of a company’s assets that is regulated by Ofwat. It reflects the spending that is recovered over time from customers.
Ofwat’s assumptions about the weighted average cost of capital, or the allowed return on investment, play an important role in how it sets allowed revenues. In choosing an assumed weighted average cost of capital, Ofwat seeks a balance between rewarding investors with a reasonable return and ensuring customers do not pay too much.34 35 In line with reductions in the cost of capital around the world, the allowed returns used by Ofwat have decreased since 1990 whilst maintaining the water sector’s ability to raise finance. In the 2020-25 period, the allowed return is set at 2.96 per cent (in Consumer Prices Index including owner occupied Housing costs – CPIH – deflated terms).36 Four water companies have a higher allowed rate of return (3.2 per cent) following a Competition and Markets Authority determination in March 2021.37
Water companies finance capital expenditure, adding new assets and enhancing services. Spending has been at a relatively stable level but fluctuates in relation to the five year investment cycles that follow Ofwat’s price reviews.
Figure D.1: Investment in water and wastewater services fluctuates with five year investment cycles
Capital expenditure by water and wastewater companies in England, 1990-91 – 2019-20
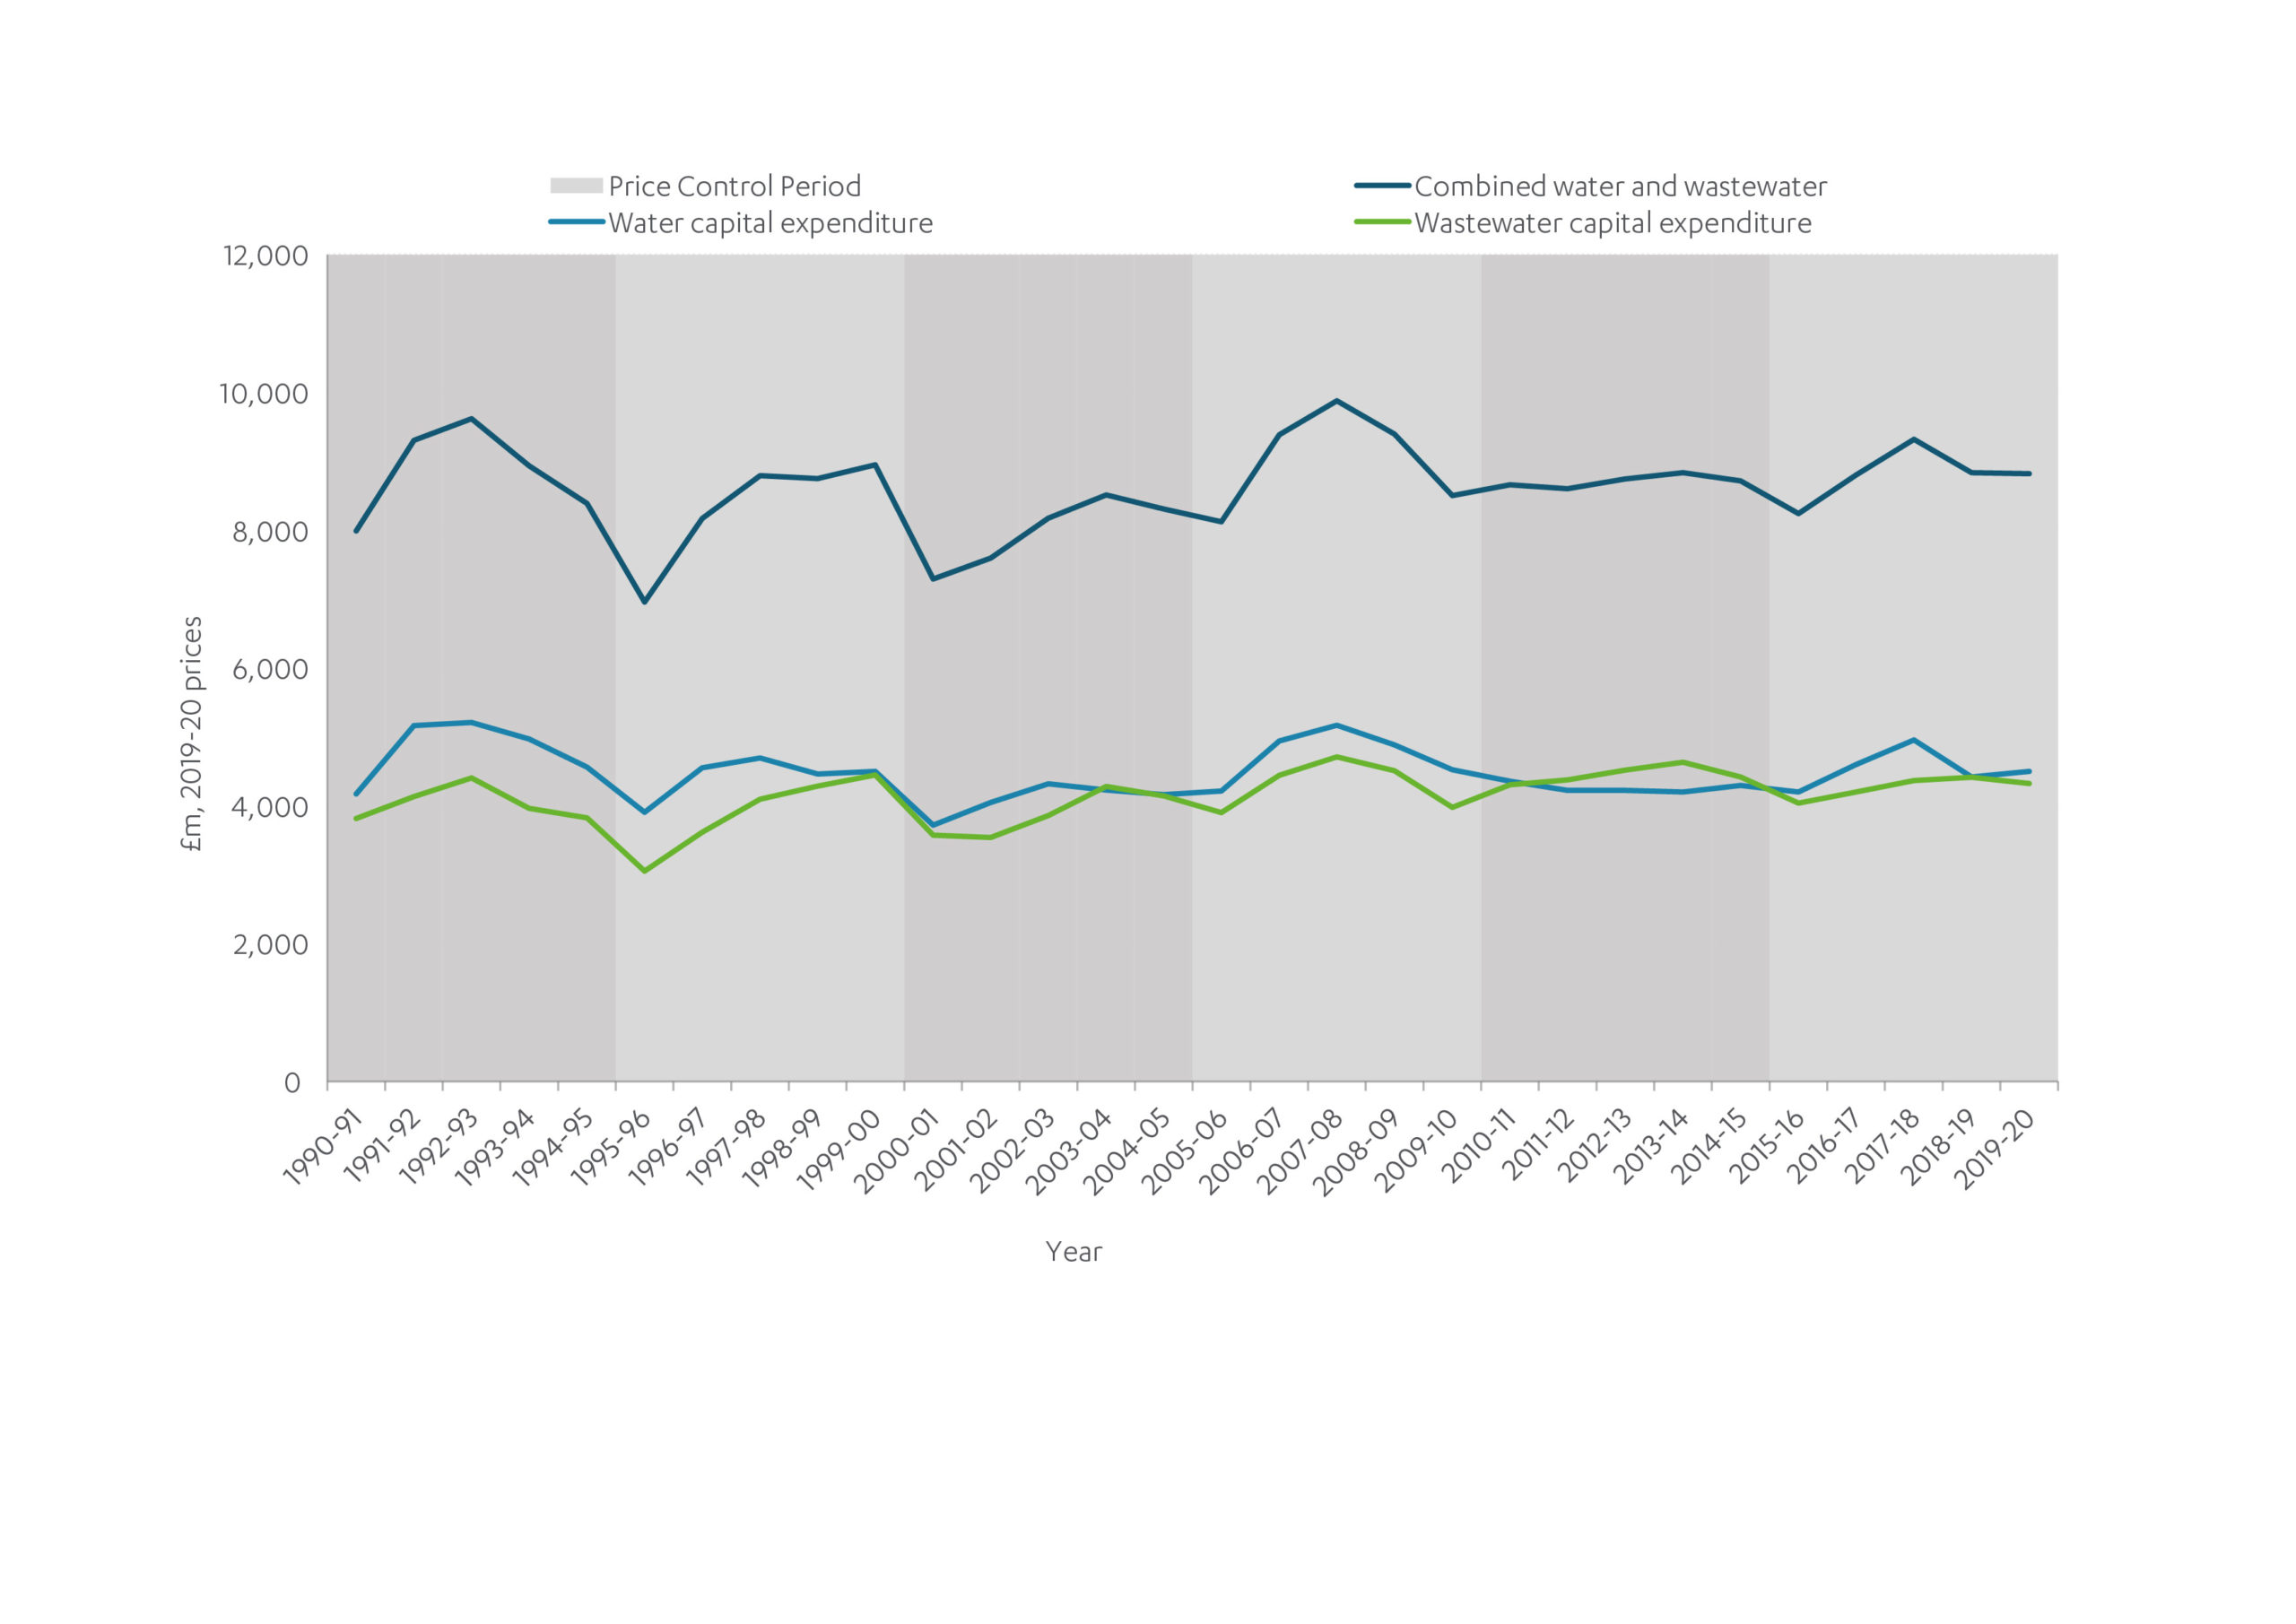
Source: Ofwat data request (2021), deflated to 2019-20 prices using HMT’s GDP deflator.
Next Section: Performance of the sector
The Commission has assessed the performance of each sector against four key criteria: quality, price, environment, and resilience. Overall, the water sector delivers water of reliable quality to homes and businesses across England.
Performance of the sector
The Commission has assessed the performance of each sector against four key criteria: quality, price, environment, and resilience. Overall, the water sector delivers water of reliable quality to homes and businesses across England.
Customers are generally satisfied with the water and wastewater services provided. Water and wastewater bills rose in real terms until 2014, but have since been falling, and are set to be reduced further between 2020 and 2024.
Large volumes of leakage in the network increase the volume of water taken from the environment. A number of surface water and groundwater water bodies and their ecosystems are under pressure because the volume of water removed for public water supply is unsustainable in those locations.
Serious pollution incidents to watercourses and coastal areas have been reducing over the last two decades but there is still more action needed to reduce pollution incidents to an acceptable level.
There has been a downward trend in the number of water supply interruptions (measured by minutes without access to water) but with no further improvements in recent years. The number of homes and businesses flooded has slowly declined over time. However, the number of properties flooded remains high with internal and external flooding increasing in the most recent year for which data is available. More intense rainfall due to climate change could lead to increases in sewer flooding without action.
Asset condition is variable with challenges around leakage levels, sewer collapses and an aging asset base. The level of leakage is still considerable within the sector, although there have been reductions in recent years. Resilience to drought remains a challenge for the sector.
Quality
Research by the Consumer Council for Water in 2019-20, shows consumer satisfaction with water and wastewater services in England and Wales is approximately 90 per cent (91 per cent for water services and 86 per cent for sewerage services).38 Consumers’ satisfaction with value for money has a score of 76 per cent.39 However, the CCW report also shows that most of these trends have not improved significantly over recent years.40
When considering public confidence in water supply and wastewater services meeting people’s needs in the next 30 years, the Commission’s social research indicated that the public’s confidence has increased from 73 per cent in 2017 to 79 per cent in 2021.41 However, the research also recognised that there was a general lack of understanding of how water is abstracted, managed and recycled.
Significant drinking water quality incidents are rare. Over 99.9 per cent of water samples meet quality standards set out in Drinking Water Regulations.42
The number of sewer blockages has been slightly decreasing over time from approximately 560 blockages per 1000km of pipe in 2012 to about 500 blockages per 1000km of pipe in 2018-19.43 However, no significant change has been seen in recent years.
Price
Following water privatisation, consumer bills increased sharply as investment was made to improve services. Ofwat estimates that the main reasons for bill increases have been the costs of maintaining existing networks and complying with environmental and drinking water legislation.44 Network efficiencies helped offset some of the cost initially but have stagnated over time.45 Water and wastewater bills rose in real terms until 2014, but have since been falling, and are set to be reduced further over the period of 2020-24.46 This is due to regulatory actions from Ofwat around reduced cost of capital and requiring the water companies to achieve greater cost efficiency.47
The price of a litre of water has been increasing over time but has been reducing since 2014.48 A unit price for wastewater was not available at the time of writing.
Figure D.2: Water and wastewater bills have been reducing since 2014
Average combined water and wastewater bills and the average price per litre of water, England and Wales, 1990-91 to 2019-20.
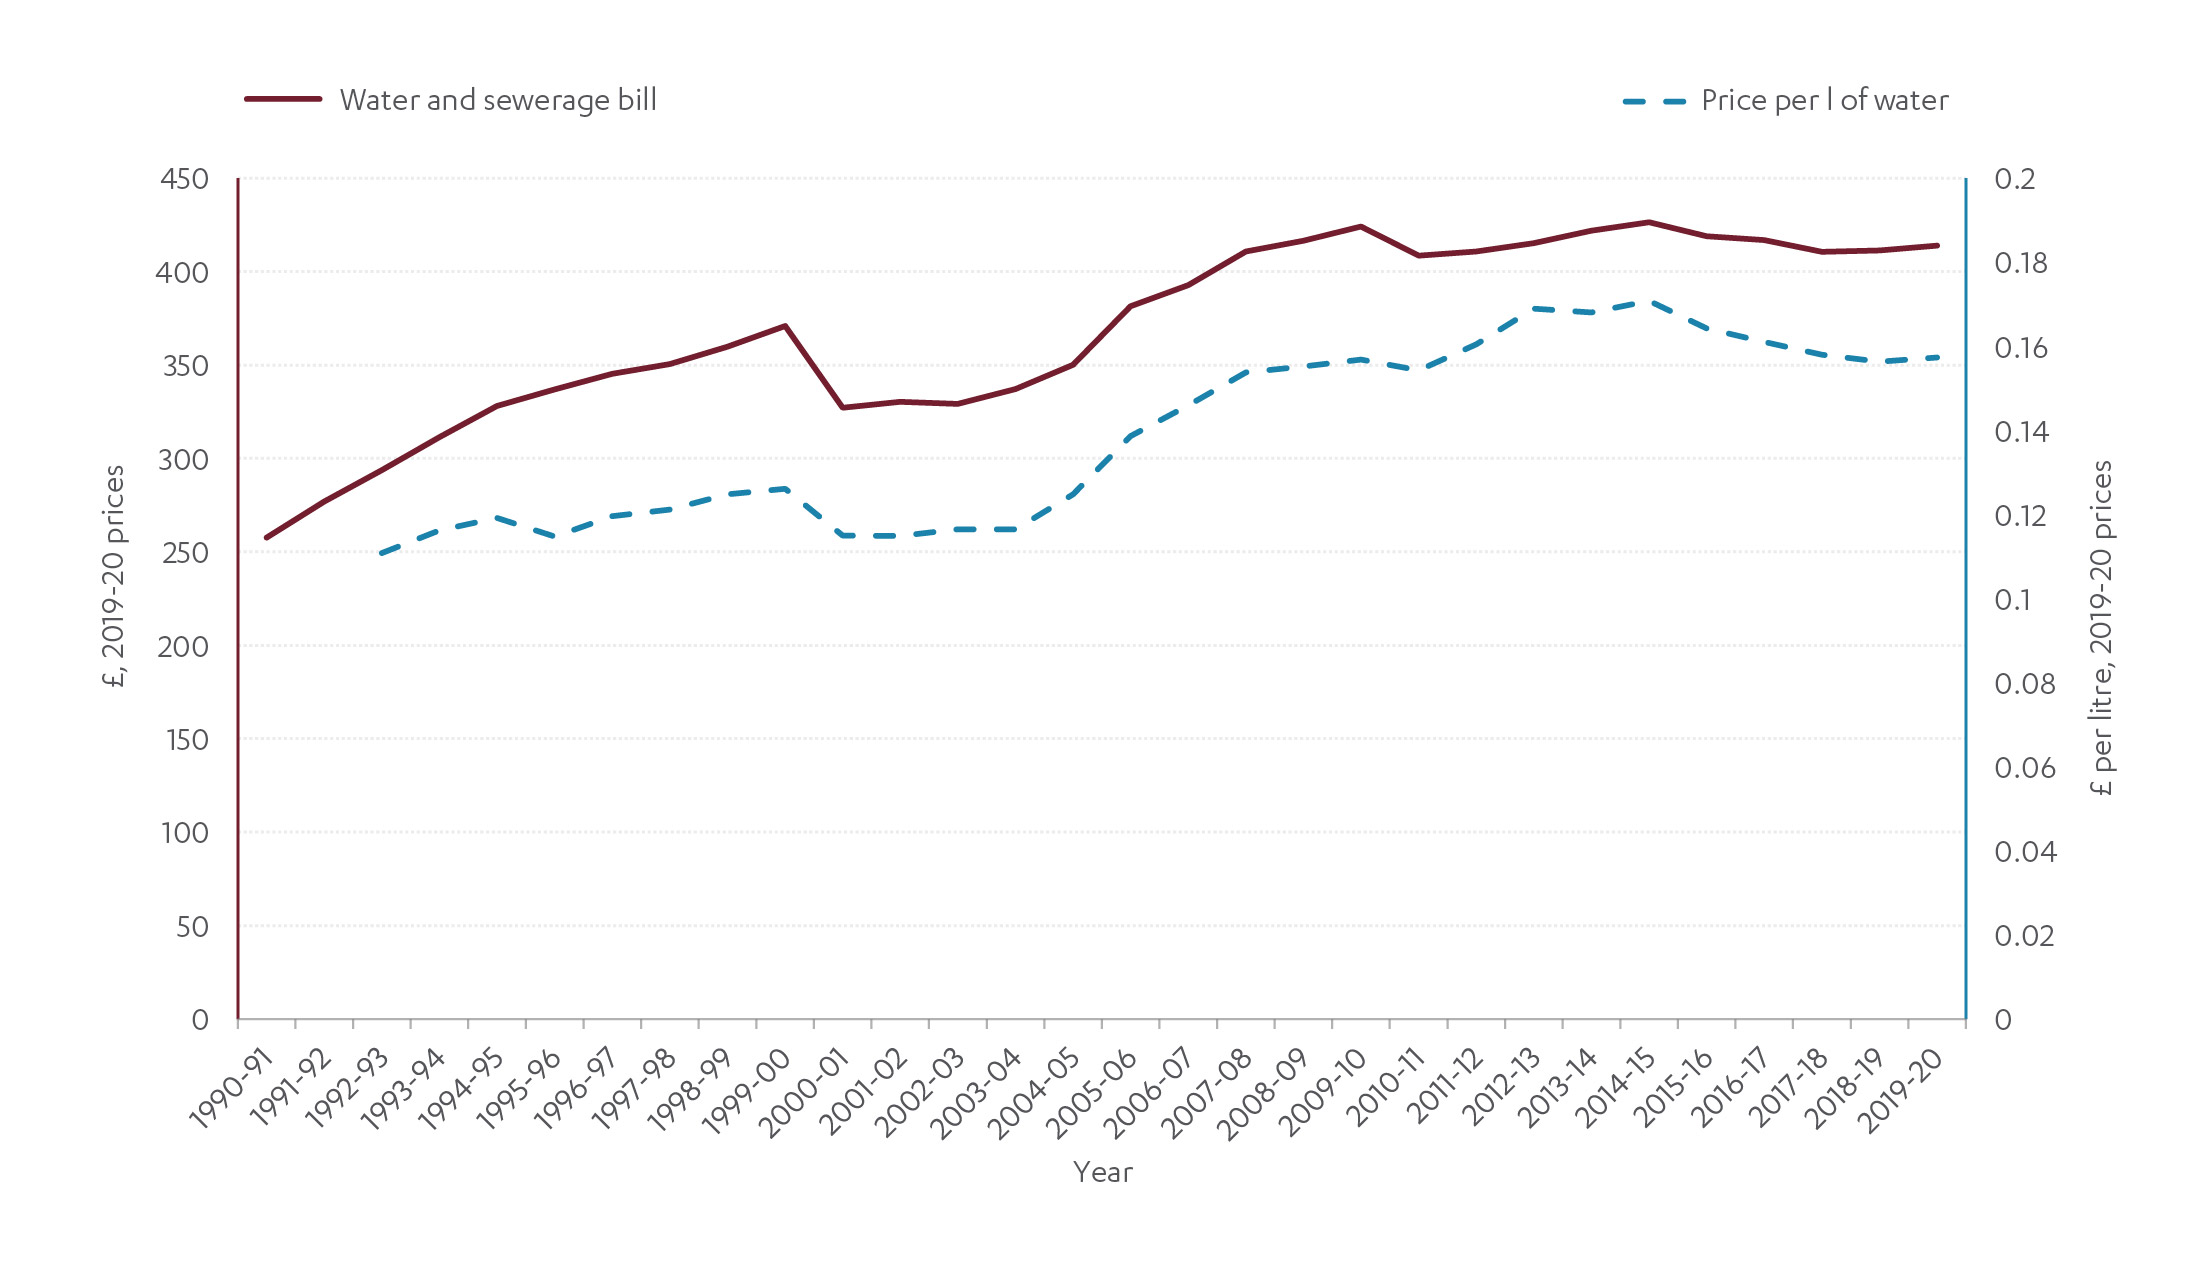
Source: Ofwat data request (2021), The Commission’s analysis
The average annual combined water and wastewater bill for domestic consumers in England and Wales was £414 in 2019-20.49 Sewerage services account for 53 per cent of the average bill.
The cost of water and wastewater varies across the country, reflecting historical and current differences in levels of investment due to differences in the environment, water availability and numbers of customers living in cities, towns, or the countryside.50 The average annual bill in the highest cost water and wastewater company area in England was 38 per cent higher than in the lowest cost company area in 2019-20.51 The cost is generally standardised across a company region with all customers on a meter paying the same price per unit or the same cost being applied to unmetered customers in properties.
Figure D.3: Water and wastewater bills vary across water and wastewater company areas in England
Average annual water and sewerage bill by water and wastewater company in 2019-2052

Source: Ofwat data request (2021)
Environment
Wastewater treatment produced less than 0.6 per cent of total UK territorial greenhouse gas emissions in 2019.53 The remaining emissions from the water and wastewater sector relate to power and transport and therefore are accounted for in the energy and transport sectors. Sewerage services account for approximately 75 per cent of water and wastewater sector emissions. In 2020, the water and wastewater industry has developed a Net Zero 2030 Routemap to cut the sector’s carbon emissions.54
The risk of pollution to watercourses by water company activity is controlled by permits issued by the Environment Agency.55 The number of serious pollution incidents (those causing major or significant and extensive impact to the environment, people or properties)56 caused by water companies decreased from 2002 but have plateaued since 2014 at unacceptably high levels.
Figure D.4: Serious pollution incidents have not reduced significantly since 2008
Number of serious pollution incidents (Category 1 and 2) caused by water and sewerage companies in England
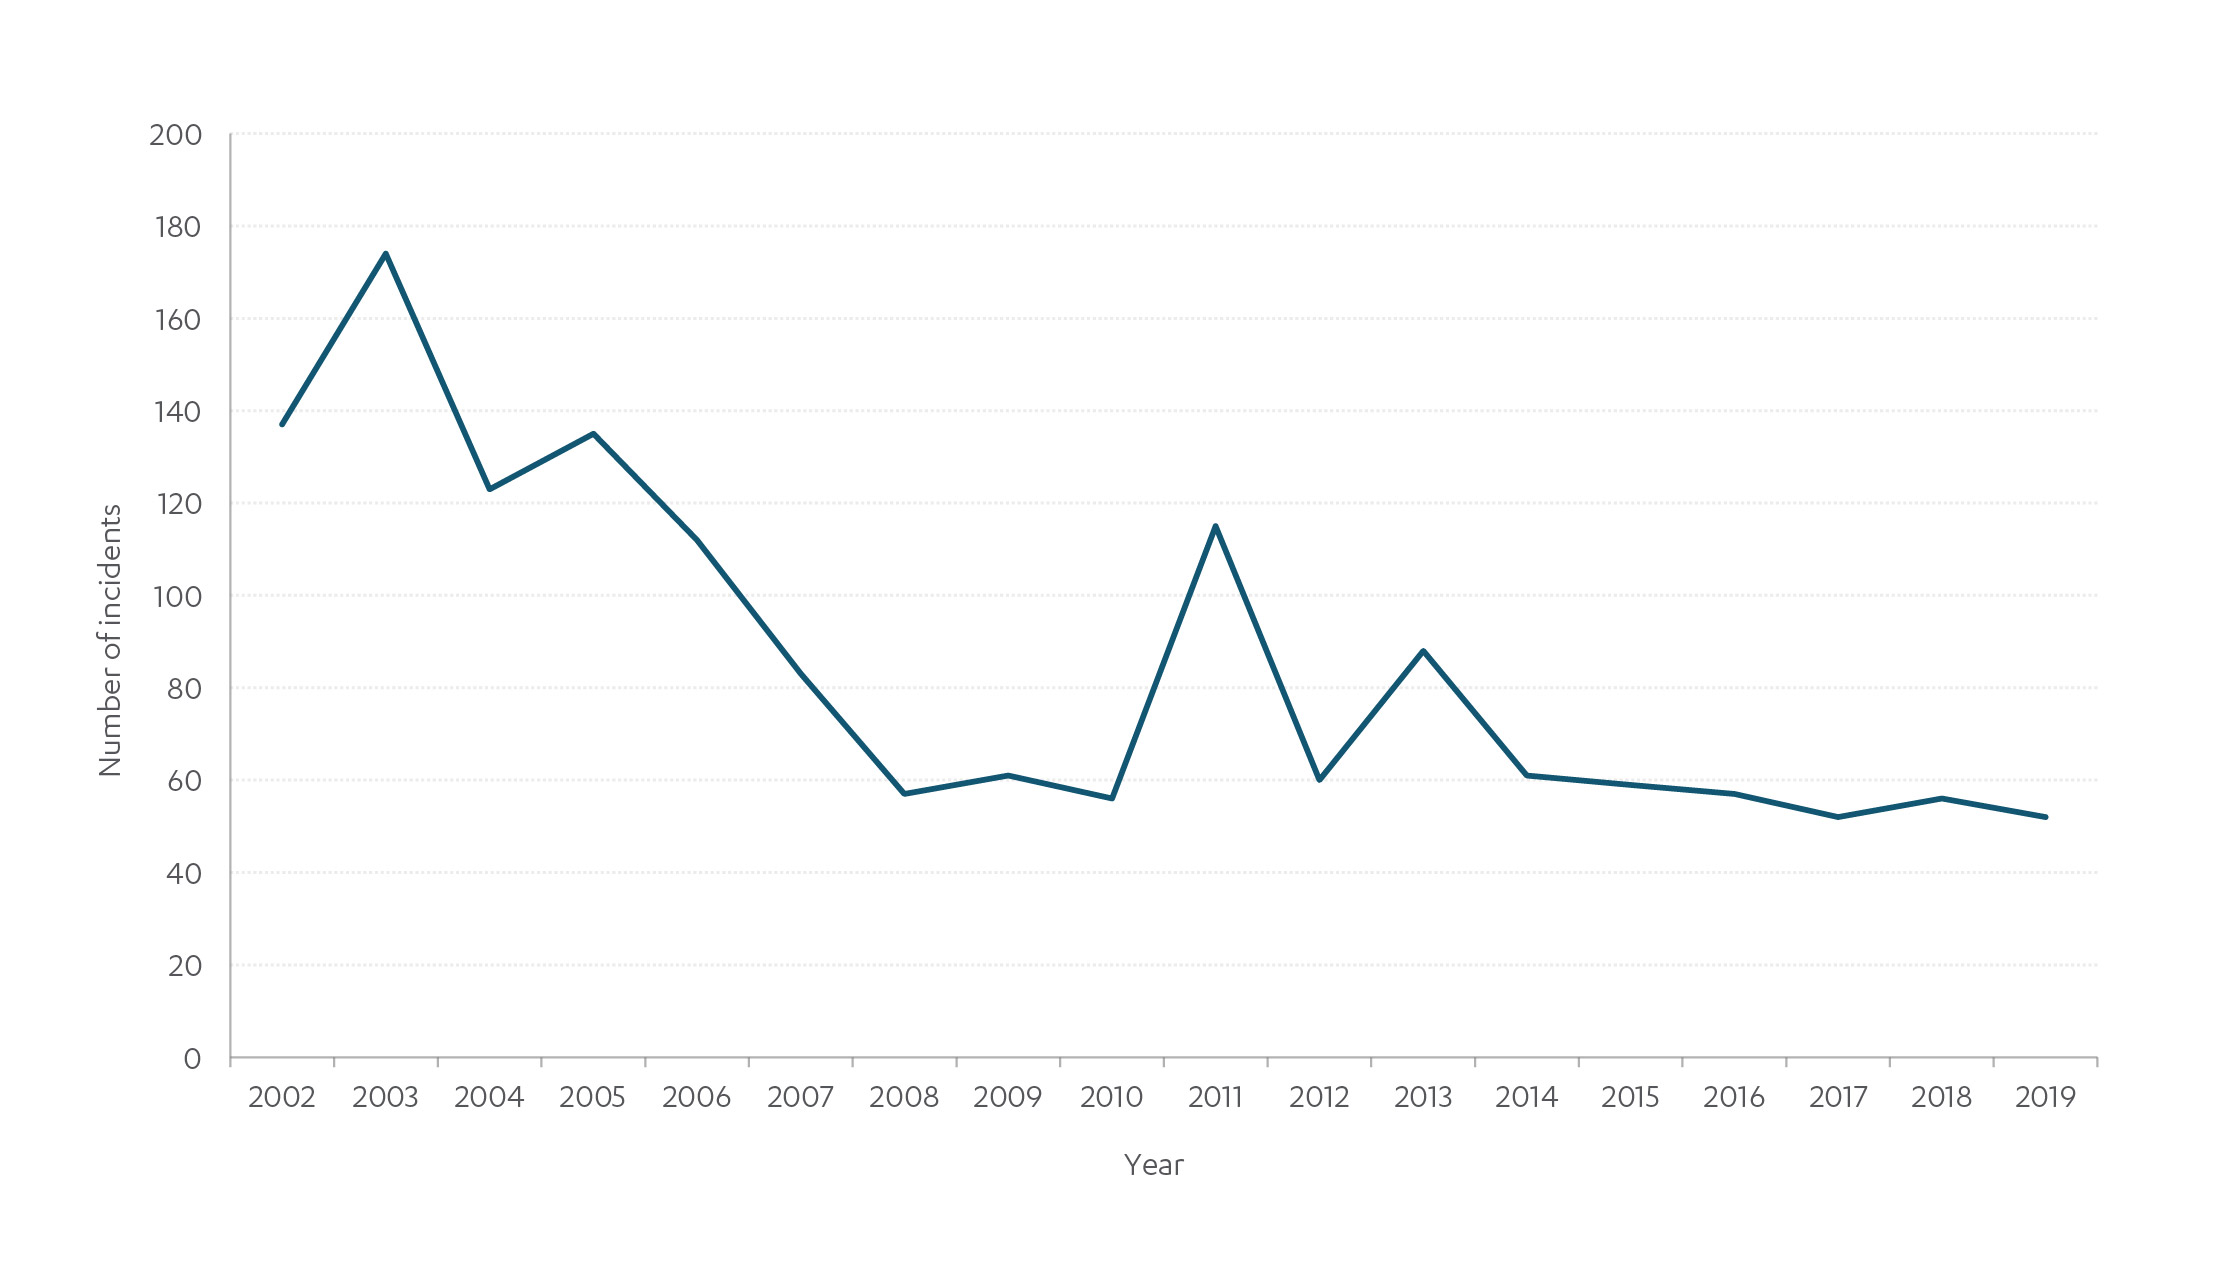
Source: Environment Agency data request (2019) and Environment Agency (2021)
River pollution primarily comes from agriculture and water industry discharges. Pollutant loads from water industry discharges have declined by nearly 70 per cent since 1995.57 Despite these improvements, around 32 per cent of water bodies are failing to achieve good ecological status due to continuous discharges from sewage treatment works and seven per cent due to intermittent stormwater overflows.58 There must be substantial improvement in both areas.
Abstracting water sustainably means that river flows and groundwater levels can support healthy ecology and natural resilience. In 2021, unsustainable abstraction affects nearly 15 per cent of surface water bodies and 27 per cent of groundwater bodies.59
Bathing water standards, which help to reduce the risk of illness to swimmers, have improved over time. Compliance with minimum standards has increased from 46 per cent in 1995 to 98 per cent in 2019.60 In 2019, 71 per cent of sites achieved the highest excellent status.61
Resilience
Flood Resilience
According to the UK Climate Change Risk Assessment in 2021, there are currently 43 water sites out of 1,009,62 and 601 sewage treatment works out of 5,458 exposed to significant surface water flooding risk (flooding from a 1 in 30 year rainfall event or greater).63 The same source points to 19 water sites and 478 sewage treatment works exposed to significant river flooding risk (1 in 75 year rainfall event or greater).
Service resilience
The water industry has reduced leakage by about 30 per cent since 1992, but since 2011 reductions have levelled off.64 In 2019-20, a new seven per cent reduction in leakage was delivered, showing progress towards Ofwat’s 2024-25 leakage reduction target of at least 15 per cent.65 Despite the reduction, almost 3,000 million litres per day were lost to leaks in England in 2019-20.66 Leakage targets are discussed further in section D.5.
Thames Water has the highest levels of leakage, with 152 litres being lost per property per day in 2019-20. This compares to an average of 98 litres lost per property per day in England.67 As water companies differ in size, leakage performance is compared on a basis of the amount of water leaked from each company’s pipes against the number of properties the company supplies.
Unplanned interruptions to water supply are one of the main measures used to assess the everyday resilience of the water supply sector. Since 2012, the average minutes lost per property per year has decreased by one third, though there has been some fluctuation in this downward trend.68 Average minutes lost reached a minimum point of 11 minutes per property per year in 2016-17, before doubling the following year.69 This drastic increase was driven in large part by the ‘Beast from the East’ freeze-thaw event. This resulted in approximately 200,000 customers across England and Wales experiencing a supply interruption of four hours or longer, including 60,000 who lost supply for 12 hours or longer.70
Figure D.5: A drastic increase in water supply interruptions due to the Beast from the East freeze-thaw event in 2017-18
Average minutes of lost water access per property per year in England and Wales

Source: CCW (2012-16) and Discover Water (2016-20)
Water mains can burst under various stresses. Pipe bursts are often caused by hot and dry or freezing cold weather, which cause the ground that surrounds the pipes to expand or contract, causing a pipe burst. There has been a 43 per cent reduction in the number of bursts per 1,000 km of mains since 1991/92 in England and Wales.71
Customers are currently eight times less likely to suffer sewer flooding than they were in 1990.72 Sewer flooding has several causes, such as heavy rainfall overwhelming the capacity of sewers or a blockage. This flooding can occur inside properties or in areas outside such as gardens or patios. The number of properties affected by internal and external sewer flooding was reducing until 2018. However, in 2019-20 more than 3,500 properties were flooded internally and almost 24,600 properties were flooded externally in England.73
Figure D.6: Internal and external sewer flooding was decreasing until 2018-19
Total number of properties flooding internally and externally in England
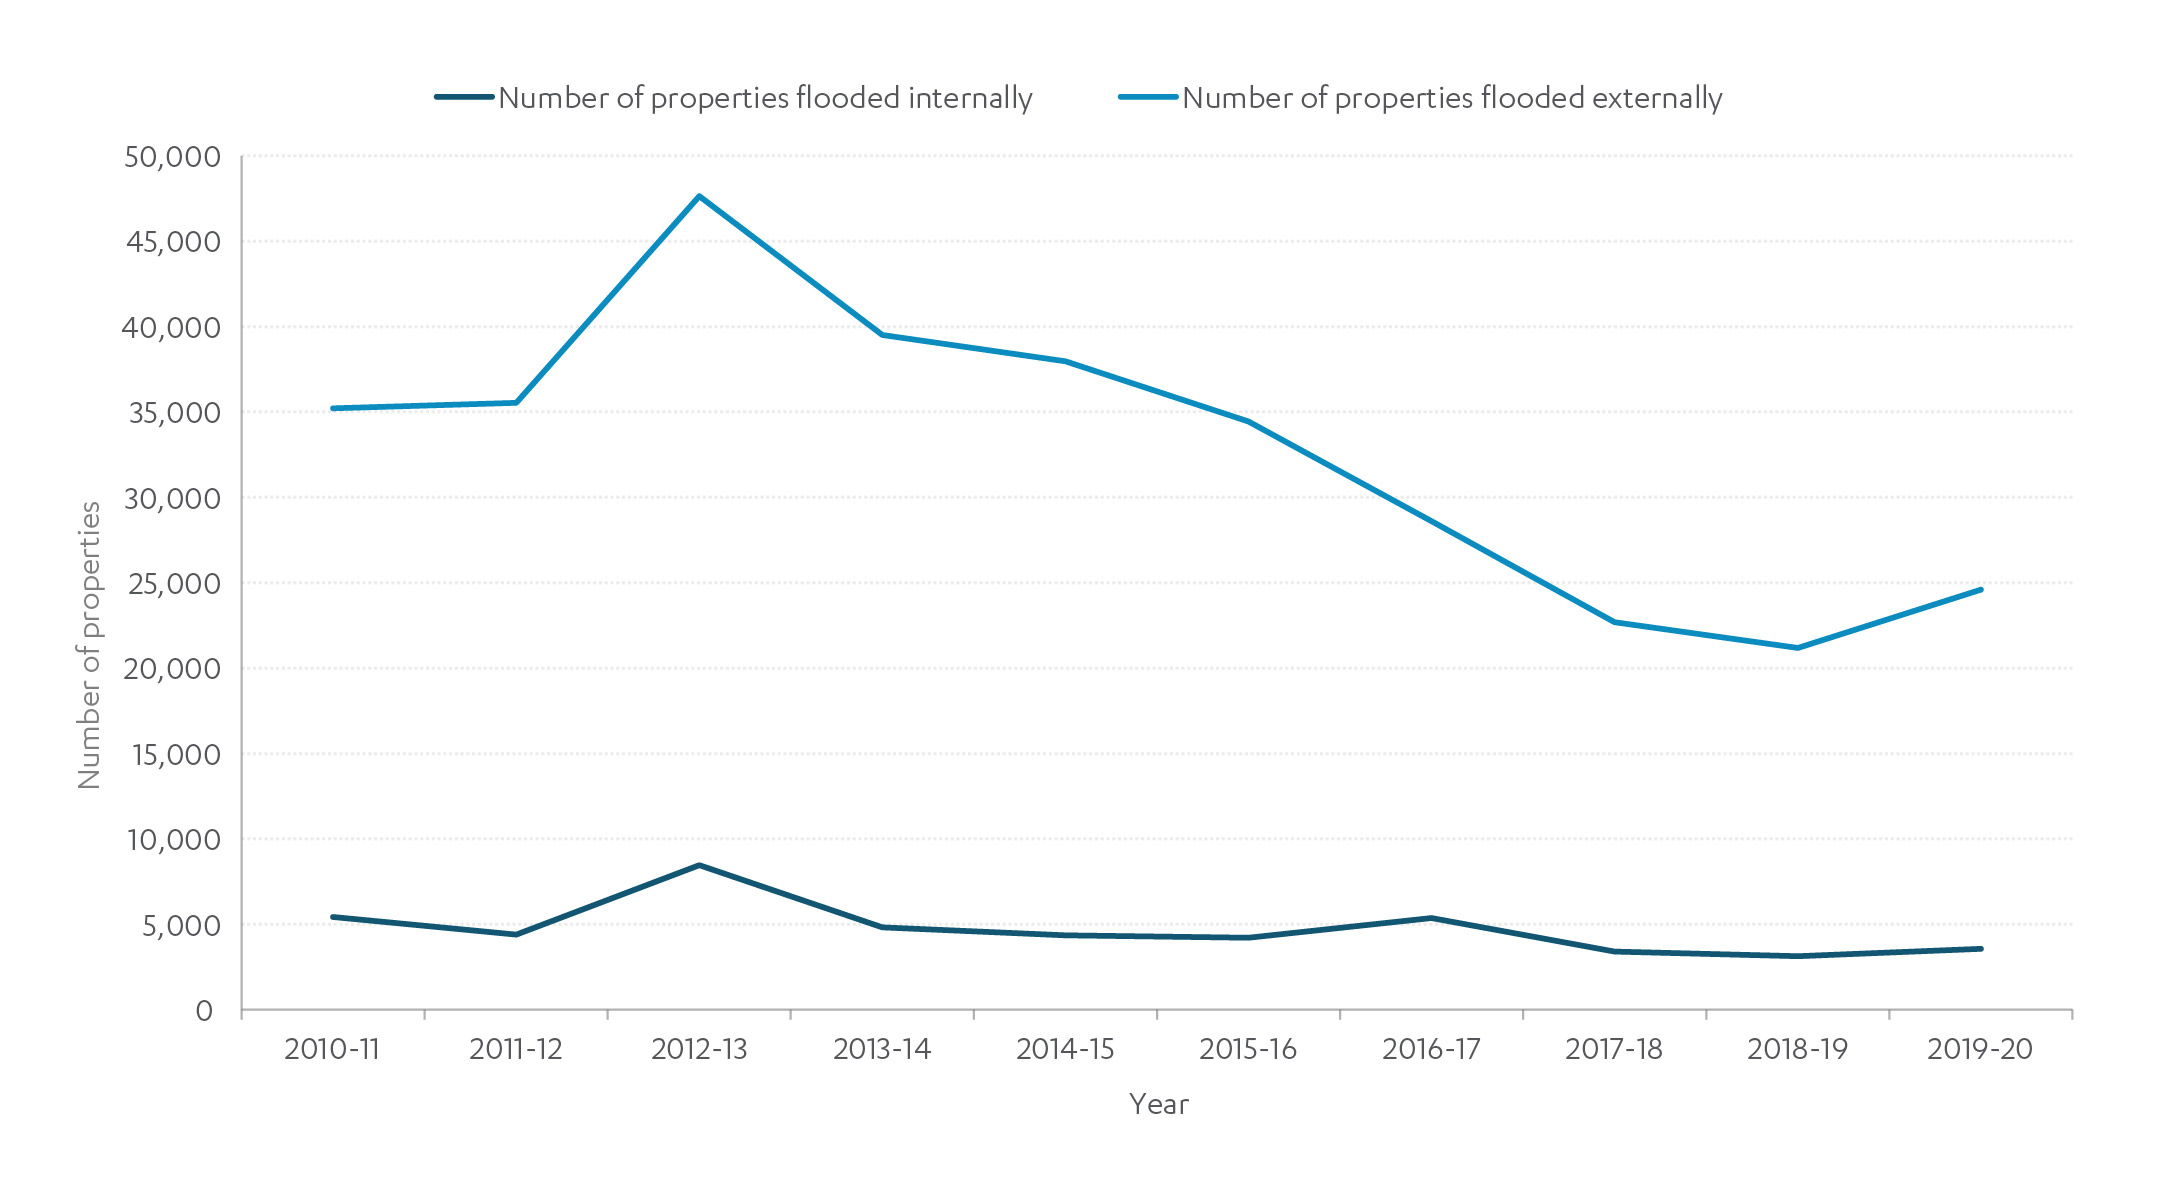
Source: CCW: Data Appendices, Water, water everywhere Resilience reports (2010-2020)
There has been an increase in the number of sewer collapses since 2011 from 6.5 to 7.5 per 1000km of pipe.74 When a sewer collapses it can cause flooding or pollution. A proactive approach to asset management with an improved understanding of asset conditions can help decrease the number of collapses.
With an average lifespan of 100 years, around 13 per cent of the total stock of water distribution pipes is over 100 years old, and this has not changed significantly over the last decade.75 Around 16 per cent of water pipes are less than twenty years old, representing both extensions to the network and the replacement of older pipes. The equivalent value for wastewater pipes is lower, around nine per cent of sewers are less than 20 years old.76
Next Section: Looking ahead
Climate change is likely to have a significant impact on water and wastewater services, see chapter 3. Changes to rainfall patterns will increase the risk of droughts and floods. Extreme weather events, including high and low temperatures, could require changes to operations and asset management practices, such as changes to drinking water quality treatment processes.
Looking ahead
Climate change is likely to have a significant impact on water and wastewater services, see chapter 3. Changes to rainfall patterns will increase the risk of droughts and floods. Extreme weather events, including high and low temperatures, could require changes to operations and asset management practices, such as changes to drinking water quality treatment processes.
In the first Assessment the Commission set out recommendations to address the challenge of drought.77 These focused on the need to develop new strategic supply and transfer infrastructure whilst simultaneously reducing demand and leakage. These recommendations have largely been endorsed by the government and the sector is implementing a clear change in approach in how it plans to ensure there will be enough water for public supply in the long term.78 The Commission will continue to monitor the progress of these changes in its Annual Monitoring Report.79
The Commission also made recommendations in relation to flood risk which are considered in Annex C Flood resilience. More intense rainfall means that the risk of surface water flooding is likely to increase. It will also increase the pressure on water company sewerage assets. This could result in more sewer flooding or more discharges from stormwater overflows which relieve pressure on sewerage systems by allowing discharges into water courses. Such discharges have become an increasing cause of concern.80 Whilst the sector is developing Drainage and Wastewater Management Plans which will help address these issues, the role of water company assets in reducing the risk of surface water flooding means they will be considered as part of the challenge on surface water set out below.
As the environmental performance section above demonstrates, the water industry has a significant role to play and more to do to protect the environment from its operations. The water sector should take further action and aim to reduce serious pollution incidents to zero and make substantial improvements to discharges from sewage treatment works and stormwater overflows. These issues will continue to be tackled through the Water Industry National Environment Programme81 which sets out the actions water companies will take, and the money they will spend, estimated at £4.6 billion82 during the current investment period between 2020 and 2025. This has been supplemented further by an additional £1.9 billion worth of spending over the same period on further environmental schemes as part of the ‘Green Recovery’.83 The Commission will monitor these issues and the water and wastewater industry’s contribution to improving the environment.
However, an integrated approach, including all activities impacting on the aquatic environment and not the water sector in isolation, is required to deliver the most effective outcomes at an efficient cost. This requires consideration of sectors, such as agriculture, that are beyond the scope of the Commission. The government is addressing this wider challenge through the 25-year Environment Plan, and a range of other environmental guidance and management plans.
The Covid-19 pandemic has had a marginal impact on water and wastewater services in England. Domestic water consumption has increased slightly whilst business consumption decreased.84 It is too early to say how permanent the change will be.
Next Section: Challenges and opportunities
The second Assessment will carry out new analysis and develop recommendations on two challenges that will affect the water and wastewater sector:
Challenges and opportunities
The second Assessment will carry out new analysis and develop recommendations on two challenges that will affect the water and wastewater sector:
Challenge 5: Asset management and resilience – the Commission will consider how asset management can support resilience, barriers to investment, and the use of data and technology to improve the way assets are maintained.
Challenge 6: Surface water management – the Commission will consider actions to maximise short term opportunities and improve long term planning, funding and governance arrangements for surface water management, while protecting water from pollution from drainage.
References
- Ofwat (2019), Regulatory capital values 2019
- Department for Environment, Food and Rural Affairs (2019), Estimated abstractions from all surface and groundwaters by purpose and EA regional charge area: 2000 to 2017, Data used: 2017Estimated abstractions from all surface and groundwaters by purpose and EA regional charge area: 2000 to 2017.
- Department for Environment, Food and Rural Affairs (2019), Estimated abstractions from all surface and groundwaters by purpose and EA regional charge area: 2000 to 2017, Data used: 2017 internal data analysis
- Ofwat (2020), State of the market 2019-20
- Discover Water (2021), Amount we use, Data accounted for England only. 2019/20
- Eureau (2017), Europe’s water in figures
- Department for Environment, Food and Rural Affairs (2019), Estimated abstractions from all surface and groundwaters by purpose and source: 2000 to 2017, Data used: 2017
- Ofwat (2021), Water Companies Contact details
- Thames Water (2021), Thames Tideway Tunnel
- Ofwat (2021), Water sector overview
- Ofwat (2021), Water sector overview
- Ofwat (2021), Water sector overview
- Ofwat (2021), Water sector overview
- Richard Macrory (1990), The Privatisation and Regulation of the Water Industry
- Ofwat (2021), Water sector overview
- Ofwat (2017), Business retail market
- Department for Environment, Food and Rural Affairs & Environment Agency (2014), Flood risk management: information for flood risk management authorities, asset owners and local authorities
- Department for Environment, Food and Rural Affairs (2021), The government’s strategic priorities for Ofwat
- Ofwat (2021), PR24 and beyond: Creating tomorrow, together
- Ofwat (2021), Water sector overview
- Ofwat (2021), Water sector overview
- Dŵr Cymru Welsh Water (2021), Annual Report
- Ofwat (2021), Licences and licensees
- Scottish Water (2021), The Water Industry in Scotland
- Scottish Water (2021), The Water Industry in Scotland
- Scottish Government (2021), Policy – Water
- Water Industry Commission for Scotland (2021), How the market works
- Northern Ireland Water (2019), Management Statement and Financial Memorandum
- Ofwat (2021), data request. Data from 2019-2020
- Ofwat (2021), State of the market 2019-20: Review of the third year of the business retail water market
- Ofwat (2019), PR19 Final Determination Policy Summary
- Ofwat (2021), Profits and dividends
- Ofwat (2019), PR19 Final Determination Policy Summary
- Ofwat (2019), PR19 final determinations
- Europe Economics on behalf of Ofwat (2019), The Cost of Capital for the Water Sector at PR19
- Ofwat (2019), PR19 Final Determination Policy Summary
- Competition and Markets Authority (2021), Summary of final determinations
- Consumer Council for Water (2020), Water Matters Highlights Report
- Consumer Council for Water (2020), Water Matters Highlights Report
- Consumer Council for Water (2020), Water Matters Highlights Report
- PWC (2021), NIA2 Social Research: Final report
- Drinking Water Inspectorate (2021), Drinking Water 2020
- Ofwat (2019), PR19 Model Wastewater Database, Data accounted for England only
- National Audit Office (2015), The economic regulation of the water sector
- National Audit Office (2015), The economic regulation of the water sector
- Ofwat (2019), PR19 Final Determination Policy Summary
- National Audit Office (2015), The economic regulation of the water sector
- The Commission’s calculations (2021)
- Ofwat (2021), data request. Data from 2019-20
- Discover Water (2021), Annual bill
- Ofwat (2021), data request. Data from 2019-20
- In some areas (not shown on this map), water is provided by water-only companies that sit within the footprint of the water and wastewater companies. Whilst including their water bill would result in slightly different averages the purpose of the map is to show variation rather than provide a comprehensives assessment.
- Department for Business, Energy & Industrial Strategy (2021), Supplementary tables: 2019 UK greenhouse gas emissions by Standard Industrial Classification
- Water UK (2020), Net Zero 2030 Routemap
- Department for Environment, Food and Rural Affairs (2021), Environmental Permitting Regulations – Discharges to water and groundwater
- Environment Agency (2019), data request
- Environment Agency (2018), The state of the environment: water quality
- Environment Agency (2021), Water and sewerage companies in England: environmental performance report for 2020
- Environment Agency (2021), Water levels and flows: challenges for the water environment
- Data available from 1995 only
- Department for Environment, Food and Rural Affairs (2021), Outcome Indicator Framework for the 25 Year Environment Plan: 2021 Update
- Ofwat (2019), PR19 Model Water Database, data accounted for England only
- Betts, R.A. and Brown, K. (2021), The Third UK Climate Change Risk Assessment Technical Report [Betts, R.A., Haward, A.B. and Pearson, K.V. (eds.)]
- National Audit Office (2020), Water supply and demand management, data available from 1992 only
- Ofwat (2020), Service Delivery report 2019-20
- Consumer Council for Water (2020), Water, water everywhere? Water & wastewater resilience report 2019/20 Data accounted for England only
- Discover Water (2021), Leaking Pipes, data accounted for England only
- Consumer Council for Water (2020), Water, water everywhere? Water & wastewater resilience report 2019/20
- Consumer Council for Water (2020), Water, water everywhere? Water & wastewater resilience report 2019/20
- Ofwat (2018), Out in the cold, water companies’ response to the ‘beast from the east’
- Ofwat (2019), data request. Data available from 1991/92 only
- Ofwat (2020), Service Delivery report 2019-20
- Consumer Council for Water (2020), Water, water everywhere? Water & wastewater resilience report 2019/20, data accounted for England only. Data does not account for multiple incidents at the same property.
- Ofwat (2019), PR19 Model Wastewater Database, data accounted for England only. Data available from 2011 only.
- Ofwat (2019), PR19 Model Water Database, data accounted for England only
- Ofwat (2019), PR19 Model Wastewater Database, data accounted for England only
- National Infrastructure Commission (2018), National Infrastructure Assessment
- National Infrastructure Commission (2021), Annual Monitoring Report
- National Infrastructure Commission (2021), Annual Monitoring Report
- Department for Environment, Food and Rural Affairs (2021), Environment Bill continues through Parliament
- Environment Agency (2020), Water Industry National Environment Programme, data in 2019/20 prices
- Ofwat (2019), PR19 Final determinations
- Ofwat (2021), Green economic recovery: Final decisions
- National Infrastructure Commission (2021), Behaviour change and infrastructure beyond Covid-19
Status: Completed
Second National Infrastructure Assessment: Baseline Report
An analysis of the current state of key infrastructure sectors
Reports & StudiesDesign & Funding Digital & Data Energy & Net Zero Environment National Infrastructure Assessment Place Regulation & Resilience Transport Water & Floods
Latest Updates

Coming up in 2024
This page shows a calendar reflecting the latest expected dates for Commission reports, publications and events. You can also sign up to receive our quarterly newsletter by entering your email address in the box at the foot of each website page.