Quality of life
Status:Final report complete. Published:
A discussion paper setting out the Commission's strategic position on its quality of life objective.
Executive summary
The National Infrastructure Commission has four objectives, which are specified as part of its remit:
- support sustainable economic growth across all regions of the UK
- improve competitiveness
- improve quality of life
- support climate resilience and the transition to net zero carbon emissions by 2050.1
The last of these was given to the Commission as a new objective in October 2021.2
The Commission is currently publishing a series of discussion papers reviewing each of the objectives. These will clarify the Commission’s interpretation of its objectives and explain how the Commission will measure the contribution its recommendations make towards its objectives.
The first discussion paper on the Commission’s competitiveness objective was published in April 2020.3 A follow up on growth across regions was published in November 2020.4 The Commission has also published work on the environment, net zero and resilience, prior to being given its fourth objective.5
This discussion paper sets out the Commission’s strategic position on its quality of life objective. The paper covers three broad areas:
- the Commission’s definition of quality of life
- infrastructure and quality of life in the UK
- how the Commission will measure this objective.
As part of interpreting the objective and approaching measurement, the Commission acknowledges there are some overlapping areas between its objectives. A key overlap is between quality of life and economic growth. This paper highlights the most relevant of these overlaps.
The Commission’s interpretation of quality of life
Quality of life usually captures how happy or satisfied people are in their lives. It encompasses a complex and interacting set of factors which operate at different scales, from individuals to communities and countries, and can be measured objectively and subjectively. These factors include, but are not limited to:
- where and how people live and work
- physical and mental health
- relationships with family and friends
- social and cultural norms
- how much control people have in their daily lives.
The Commission defines quality of life as an objective and subjective assessment of an individual’s overall wellbeing. The link between economic infrastructure and quality of life is indirect.6 This means the Commission’s recommendations are likely to have an impact via multiple ‘domains’, which in turn affect quality of life (see the figure 1 below).
Figure 1: Impact of the Commission’s recommendations
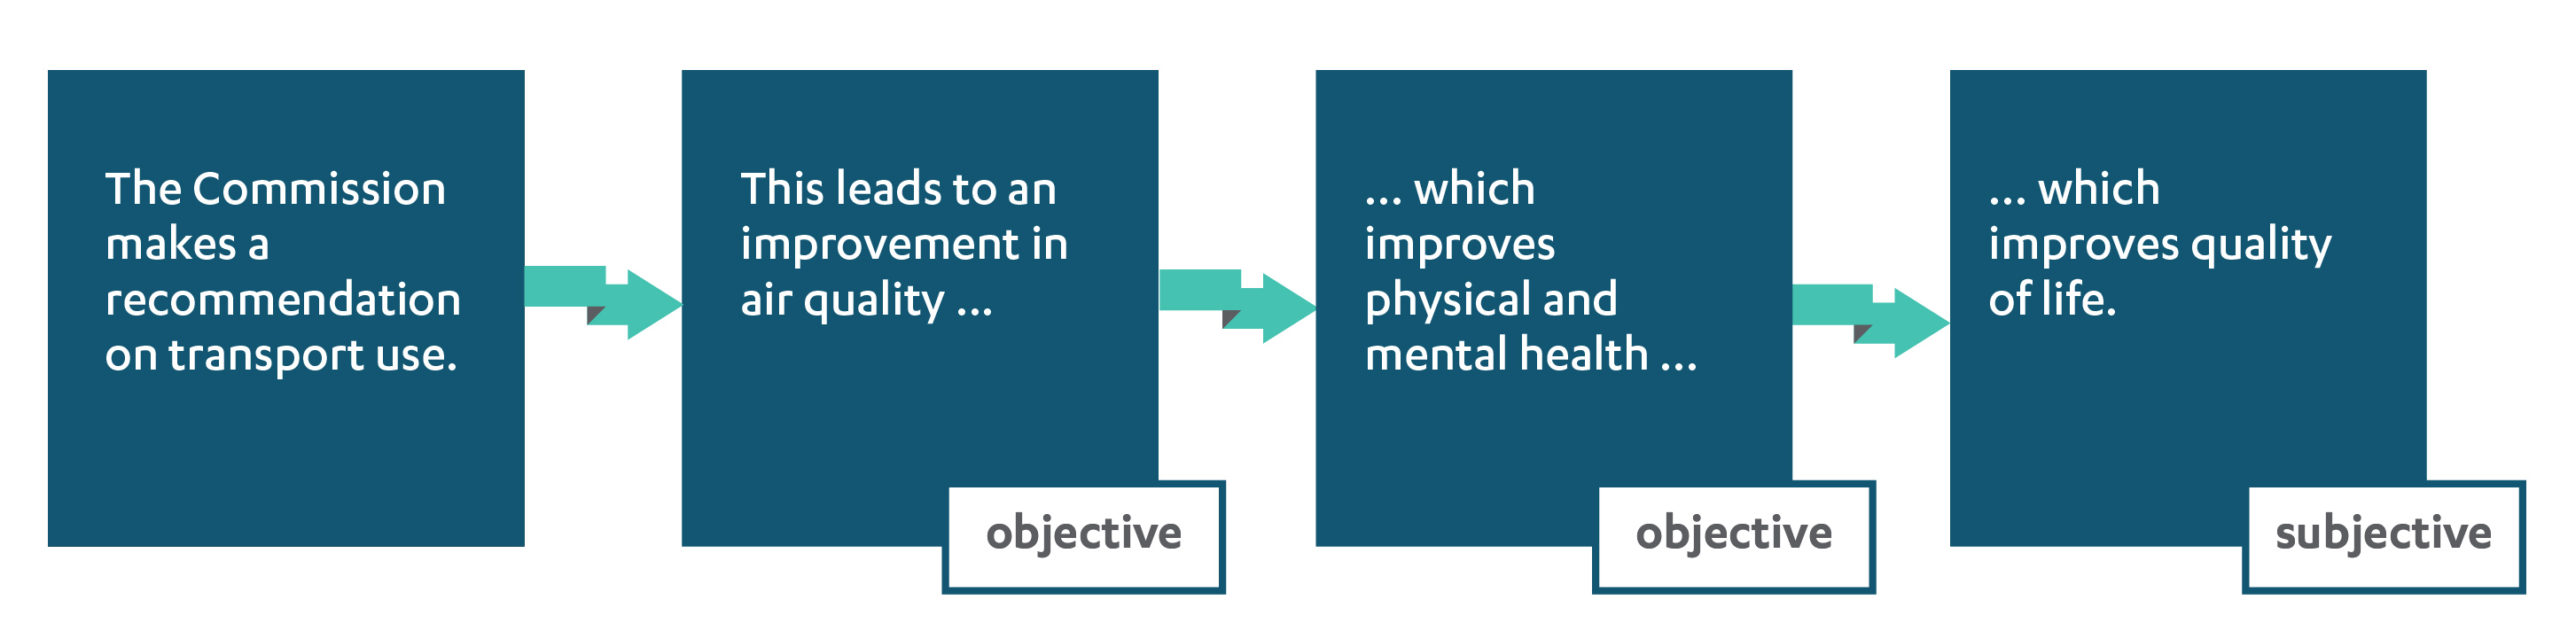
The Commission will therefore assess the impact of infrastructure on quality of life via a series of domains, an approach adopted by many organisations. The Commission’s domains are derived from the ONS wellbeing dashboard, which is made up of ten domains, focusing on those that directly relate to infrastructure. The domains are set out in Table 1 below.
Table 1: The Commission’s quality of life domains
| Domain name | Definition | Relevant ONS domain(s) |
|---|---|---|
| Health | The impacts of infrastructure services on physical and mental health | Health Personal Wellbeing |
| Local and natural surroundings | The impact of infrastructure design and operation on the local and natural environment | Environment Where we live now |
| Connections | The physical connections (transport networks) and digital connections (fixed and mobile broadband) that link people, communities and businesses | Relationships What we do Where we live |
| Affordability | The distributional impact of the cost of infrastructure services that domestic consumers pay through bills or fares and the overall cost of infrastructure over time | Personal finance |
| Comfort and convenience | Users’ experience with infrastructure services including the level of satisfaction derived from these services | Personal wellbeing Where we live |
| Employment | How infrastructure acts as an enabler for patterns of economic activity and therefore access to jobs | What we do |
Infrastructure and quality of life in the UK
The UK’s economic infrastructure provides essential services and a range of benefits that underpin people’s livelihoods and the economy. However, quality of life varies between different types of places, with differences in the built environment, including infrastructure contributing to this. This is because there is spatial variation of provision in some sectors such as transport and digital connectivity, and in levels of resilience to hazards such as floods. However, many services such as water and electricity are provided universally across different types of places.
Historically, infrastructure transformed how and where people lived and worked. While, modern infrastructure has created a new set of problems, these are of a different scale compared to the historic issues that were characterised by a lack or absence of quality infrastructure – such as a lack of clean water and basic sanitation. In many ways, infrastructure has solved more problems than it has created.
For example, infrastructure contributes to health through the provision of clean water and access to health services, but air and noise pollution are damaging to health. Infrastructure can contribute to the local and natural surroundings through good urban design, access to blue and green spaces and reducing or capturing pollution and greenhouse gas emissions. But poorly designed infrastructure can lead to biodiversity loss. Similar opportunities and risks exist across all the domains.
Overall, the Commission recognises that improving quality of life involves improving and maintaining the benefits from using infrastructure and minimising the negative impacts.
Measuring the objective
The Commission has developed a framework to measure how infrastructure can improve quality of life outcomes using the six domains set out in Table 1. The Commission will apply this framework in its future work including the second National Infrastructure Assessment. However, it will be applied proportionately, as some recommendations will not have quality of life impacts and others will only be relevant to a few domains.
The Commission welcomes comments on this discussion paper, including evidence on how infrastructure affects quality of life and ways that the Commission could monitor and measure impacts. Please send any comments to NICdiscussionpapers@nic.gov.uk by 31 October 2022.
Next Section: Interpreting the objective
The Commission’s definition of quality of life
Interpreting the objective
The Commission’s definition of quality of life
The Commission defines quality of life as an objective and subjective assessment of an individual’s overall wellbeing.
The Commission will assess the impact of infrastructure on quality of life through six domains, considering impacts to direct users and third parties (e.g. externalities). The Commission has chosen to use domains, rather than a sector by sector approach, to better capture cumulative effects across sectors.
These domains are derived from the Office for National Statistics’ wellbeing dashboard, which is made up of ten domains.7 The Commission’s domains and their subcomponents directly relate to infrastructure. Issues covered by the Commission’s other objectives or outside the Commission’s remit are excluded.
Table 2 sets out the definitions of the Commission’s six domains and the relevant Office for National Statistics domains captured.
Table 2: The Commission’s quality of life domains
| Domain name | Definition | Relevant ONS domain(s) |
|---|---|---|
| Health | The impacts of infrastructure services on physical and mental health | Health Personal Wellbeing |
| Local and natural surroundings | The impact of infrastructure design and operation on the local and natural environment | Environment Where we live now |
| Connections | The physical connections (transport networks) and digital connections (fixed and mobile broadband) that link people, communities and businesses | Relationships What we do Where we live |
| Affordability | The distributional impact of the cost of infrastructure services that domestic consumers pay through bills or fares and the overall cost of infrastructure over time | Personal finance |
| Comfort and convenience | Users’ experience with infrastructure services including the level of satisfaction derived from these services | Personal wellbeing Where we live |
| Employment | How infrastructure acts as an enabler for patterns of economic activity and therefore access to jobs | What we do |
[Reference for third column8]
The remaining three domains from the ONS are excluded for the following reasons:
- Education and skills: Levels of educational achievement and skills are not directly related to infrastructure
- Governance: Although the Commission views infrastructure governance as important for achieving its objectives, the Office for National Statistics’ definition covers democracy (i.e. voter turnout) and trust in institutions which are not directly related to infrastructure
- Economy: This is covered by the Commission’s objective on economic growth, which mainly focuses on productivity.9
As part of the Commission’s domains, resilience is one factor that affects all infrastructure sectors and will be considered under the most relevant domains. Based on the Commission’s framework for measuring the quality of infrastructure set out in the first Assessment,10 resilience is made up of two factors:
- Everyday resilience: This refers to short term resilience events such as delays and cancellations on public transport. This will be covered under the ‘comfort and convenience’ theme, as these issues usually pose a temporary risk to a user’s experience and therefore quality of life.
- Resilience to large shocks: Serious resilience events with substantial and potentially long term impacts to quality of life. These issues will be covered under the ‘health’ theme as these shocks (e.g. flood events and droughts) have severe consequences to physical and mental health.
The following sections provide further detail on the definitions of quality of life and wellbeing and approaches to domains used by the Office for National Statistics and other organisations. This provides context for the Commission’s approach set out above.
What is meant by quality of life?
Quality of life is a broad concept that lacks a universal definition. Key definitions of quality of life include:
- World Health Organisation: “An individual’s perception of their position in life in the context of the culture and value systems in which they live and in relation to their goals, expectations, standards and concerns”11
- NHS Wales: Quality of life contains several core components – physical wellbeing, functional wellbeing, emotional wellbeing, social wellbeing, expectation and perception and unmet needs12
- Institute for Work and Health: “Quality of life embodies overall wellbeing and happiness, including access to school, work opportunities, absence of military conflict or threats, as well as good physical and emotional health. It’s relative, subjective and has intangible components, such as spiritual beliefs and a sense of belonging”13
- Centres for Disease Control and Prevention: “A broad multidimensional concept that usually includes subjective evaluations of both positive and negative aspects of life.” A number of domains are referenced, which include: health, jobs, housing, schools, neighbourhoods, culture, values and spirituality14
- United Nations: Quality of life is the ‘notion of human welfare (wellbeing) measured by social indicators rather than by quantitative measures of income and production.’15
Many of the definitions set out above make clear reference to wellbeing. Wellbeing and quality of life interact, so it is worth examining definitions of wellbeing too.
Wellbeing definitions fall into two main categories: objective and subjective. Objective wellbeing includes measures of an individual’s income, wealth, and health (and measures of the wider socioeconomic and environmental context), whereas subjective wellbeing uses quantitative measures to capture individuals’ perceptions of their wellbeing.16
One of these subjective wellbeing measures is life satisfaction. Figure 2 shows average life satisfaction in the UK declining in 2020, reflecting the impact of the Covid-19 pandemic on personal wellbeing.
Figure 2: Average life satisfaction has been broadly stable over the past decade, although it declined considerably in 2021
Average Life Satisfaction scores in the UK, Q2 2011 – Q2 2021 (seasonally adjusted)
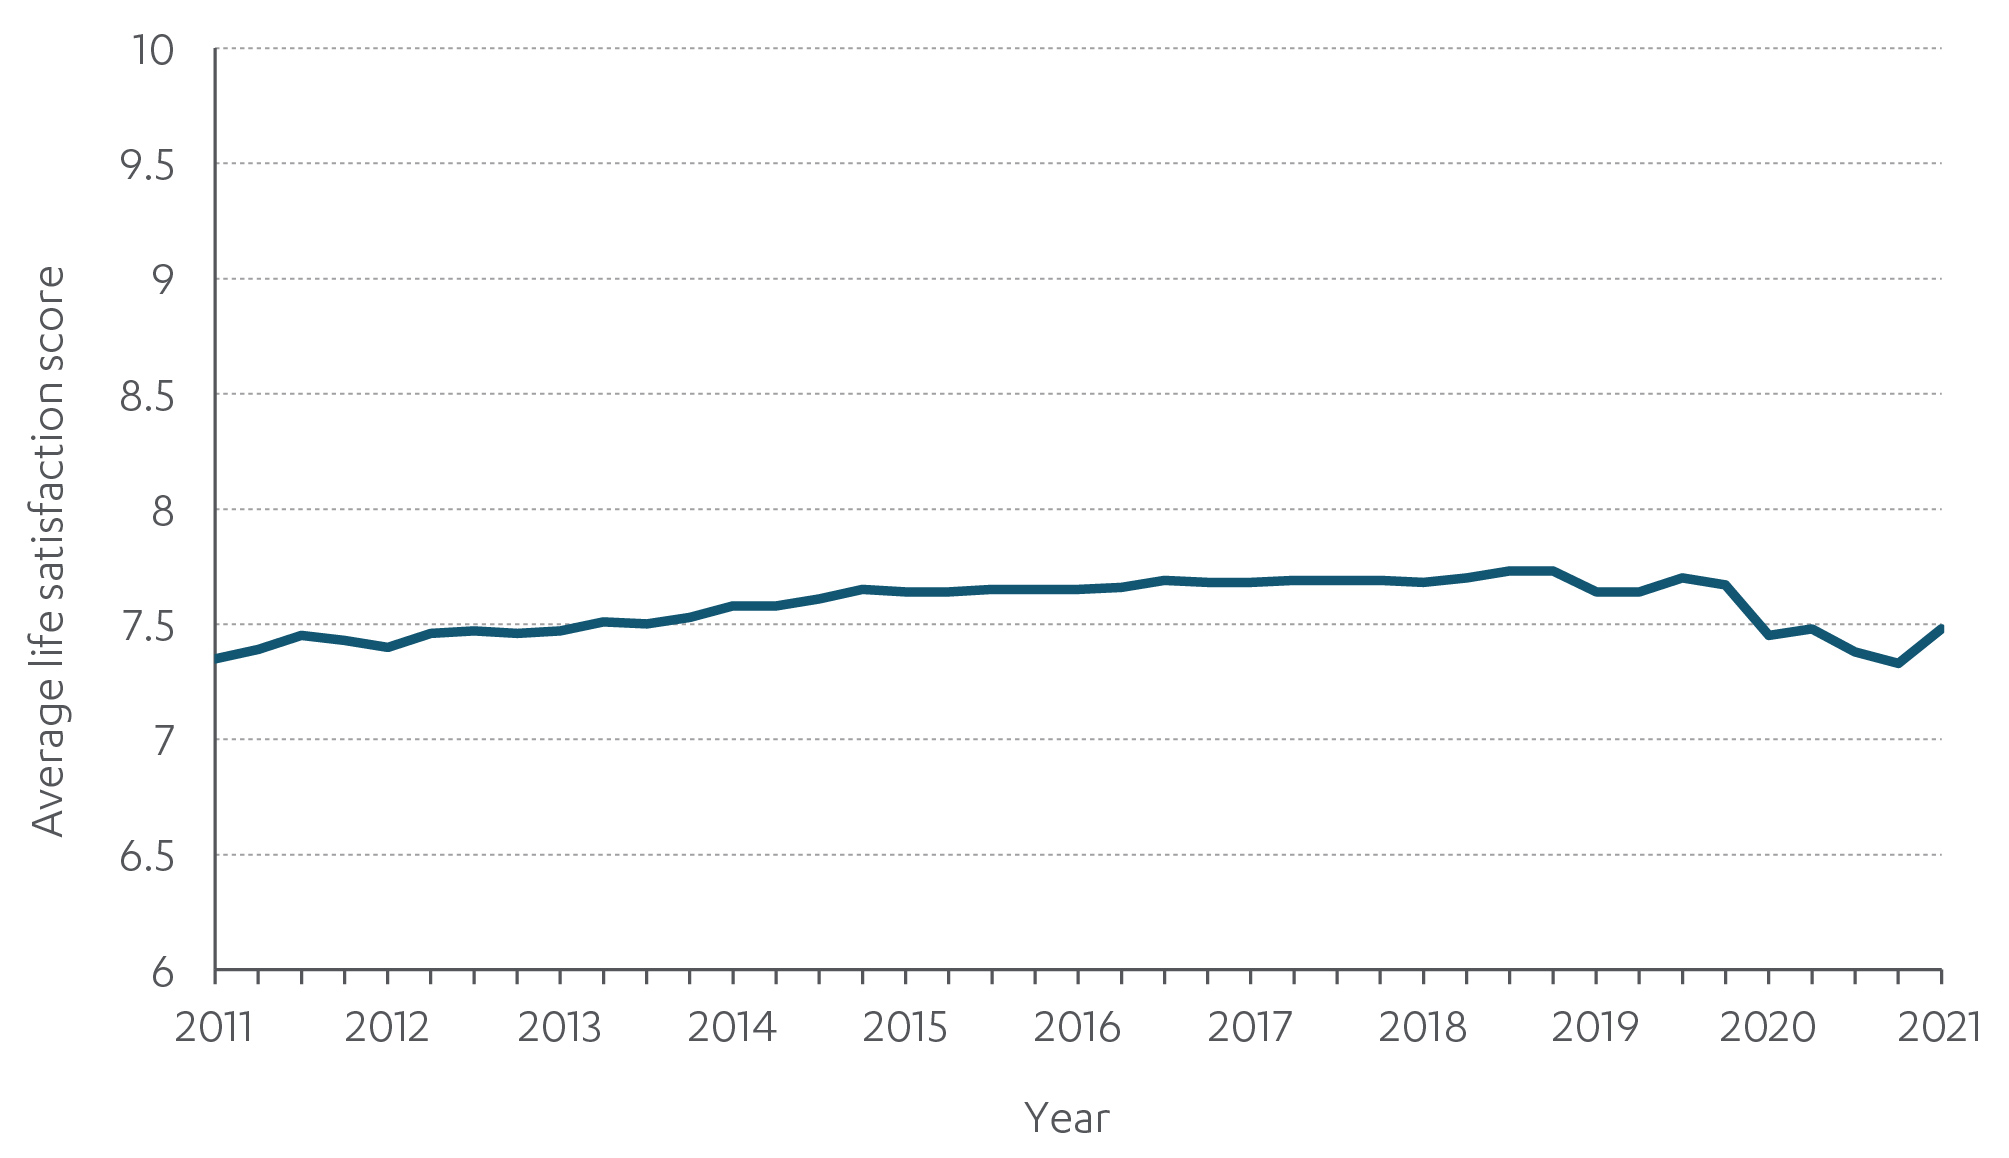
Source: Office for National Statistics (2021), Quarterly Well-being Estimates. Life satisfaction scores are self-reported on a scale from 0 to 10.
Key definitions of wellbeing include:
- Office for National Statistics: “How we are doing as individuals, as communities and as a nation, and how sustainable this is for the future.”17 The What Works Centre for Wellbeing has also adopted this definition and set of dimensions to measure national wellbeing18
- Centres for Disease Control and Prevention: “The presence of positive emotions and moods, the absence of negative emotions, satisfaction with life, fulfilment and positive functioning”19
- Organisation for Economic Cooperation and Development framework for measuring wellbeing: The framework identifies the following three pillars for measuring and understanding wellbeing – material living conditions, quality of life and sustainability20
- Department of Health: “Wellbeing is about feeling good and functioning well and comprises an individual’s experience of their life; and a comparison of life circumstances with social norms and values.”21
While wellbeing and quality of life are sometimes used interchangeably, there are other views. For example, the World Health Organisation views quality of life to be a broad and complex concept that differs according to the cultural and environmental context which should not be equated with wellbeing.22 The Organisation for Economic Cooperation and Development, meanwhile, views quality of life as a component of wellbeing – quality of life is included in one of the ‘three pillars’ within their ‘framework for measuring wellbeing’.23
Quality of life is measured using ‘domains’
Despite the differences in interpretations across definitions, what is common to most approaches is the use of domains. Furthermore, the nature of the domains used tends to be similar.
The Office for National Statistics’ wellbeing dashboard, made up of ten domains, provides a starting point for highlighting these similarities. The ten domains are:
- Economy: Includes measures of inflation and public sector debt
- Education and skills: Includes aspects of education and the stock of human capital in the labour market, such as levels of educational achievement and skills
- Environment: Includes areas such as climate change, the natural environment and the effects people’s activities have on the global environment
- Governance: Includes democracy and trust in institutions
- Health: Includes both subjective and objective measures of physical and mental health
- Our relationships: Includes satisfaction with personal relationships and feelings of loneliness
- Personal finance: Includes household income and wealth, its distribution and stability
- Personal well-being: Includes individuals’ feelings of satisfaction with life, whether they feel the things they do in their life are worthwhile and their positive and negative emotions
- What we do: Includes work and leisure activities and the balance between them
- Where we live: Includes having a safe, clean and pleasant environment, access to facilities and being part of a cohesive community.24
Table 3 sets out examples of domains and subdomains from different quality of life and wellbeing frameworks. These are set against the Office for National Statistics domains defined above.25
Table 3: A comparison of quality of life and wellbeing domains across key frameworks
| ONS Measures of National Wellbeing | WHO quality of life instruments | OECD's How's life? framework for measuring wellbeing | Eurostat quality of life dimensions |
|---|---|---|---|
| Economy | Not included | Not included | Not included |
| Education and skills | Environment: 'opportunities for acquiring new skills and information' subdomain | Education and skills | Education |
| Environment | Environment: 'physical environment' subdomain | Environmental quality | Natural and living environment |
| Governance | Not included | Civic engagement and governance | Governance and basic rights |
| Health | Physical | Health status | Health |
| Our relationships | Social relationships | Social connections | Leisure and social interactions |
| Personal finance | Environment: 'financial resources' subdomain | Income and wealth | Material living conditions |
| Personal wellbeing | Psychological | Subjective wellbeing | Overall experience of life |
| What we do | Level of independence: specifically, the 'activities of daily living' and 'work capacity' subdomains | Work and life balance | Productive or main activity |
| Where we live | Not included | Housing | Economic security and physical safety |
| Not included in ONS domains | Spirituality, religion and personal beliefs | Not applicable | Not applicable |
References for Column 126; Column 227; Column 328; Column 429.
The table shows that the types of domains are relatively consistent across these different frameworks, even though the approaches differ between them. It also shows that there are differences in defining domains. Specifically, there are cases where elements of a particular domains are consistent across all frameworks. However, there are other domains which are almost identical across frameworks, including health, relationships, environment and income.
Overall, the general approach to domains that make up quality of life or wellbeing is largely similar. On that basis the Commission’s definition and domains adapts the Office for National Statistics’ framework to assess the impact of infrastructure on quality of life, as set out earlier in this section (see Table 2).
The next section explores the relationship between infrastructure and quality of life in detail including the evidence base.
Infrastructure and quality of life in the UK
The UK’s economic infrastructure provides essential services and a range of benefits that underpin people’s livelihoods and the economy. Without infrastructure, housing cannot be built where people want to live and people cannot move between where they want to live and where jobs are located.30
Quality of life does vary between different types of places, with differences in the built environment, including infrastructure, contributing to this (see box 1 below). Many infrastructure services are provided universally across different types of places, although there is spatial variation of provision in some sectors such as transport and digital connectivity and in levels of resilience to hazards such as floods.
Box 1: Quality of life in the UK varies between places
It is reasonable to expect different quality of life experiences – positive and negative – in different types of places.31 This is partly because fundamentally different types of places, such as urban and rural areas, offer different things to households and businesses and these have implications for the shape of the built environment, including infrastructure. This is due to the trade offs in the costs and benefits of density (e.g. there are more jobs in urban areas but they are more congested and polluted) and space (e.g. rural areas have better access to nature but are more isolated).32
In addition, the risk of natural hazards such as flooding and droughts and the resilience of infrastructure assets vary spatially.33 Those in higher risk areas are more likely to experience quality of life impacts if those risks materialise. Climate change also means areas that would have been considered low risk may be more vulnerable in future.34
Figure 3 presents the range of life satisfaction scores for local authorities in each region in England. Figure 4 plots population density against life satisfaction for local authorities in England to show differences in life satisfaction between urban and rural areas.
Figure 3: Major cities outside of London in England report lower levels of life satisfaction below the average for their region
Average life satisfaction scores across regions (England, 2020/21)
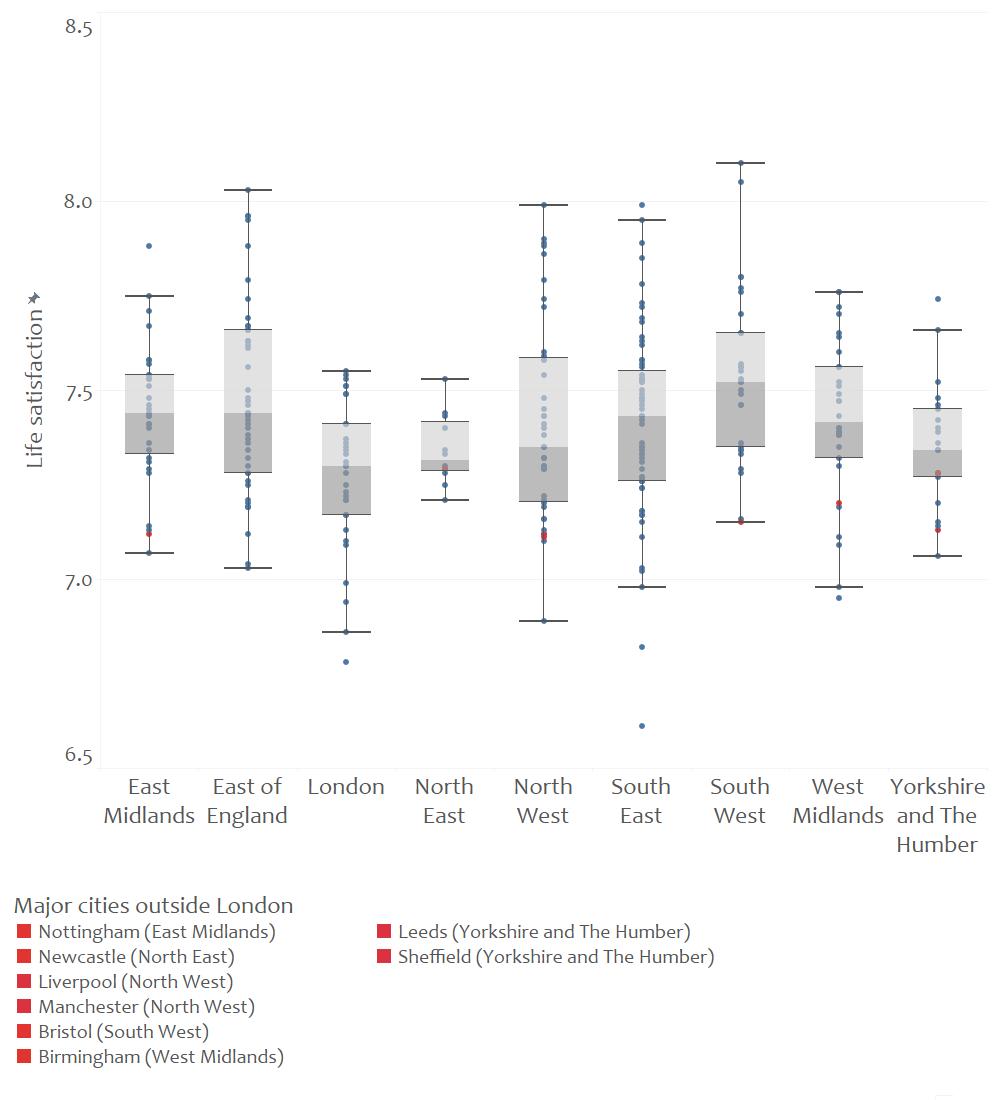
Source: Office for National Statistics (2021), Quarterly Well-being Estimates. Life satisfaction scores are self-reported on a scale from 0 to 10. The charts shows the median (line where grey boxes meet), interquartile range (the two grey boxes together), main range (between the vertical black lines) and statistical outliers (dots)
Figure 4: Areas with lower population densities are associated with higher life satisfaction
Population density for local authorities versus life satisfaction (England, 2020/21), including region
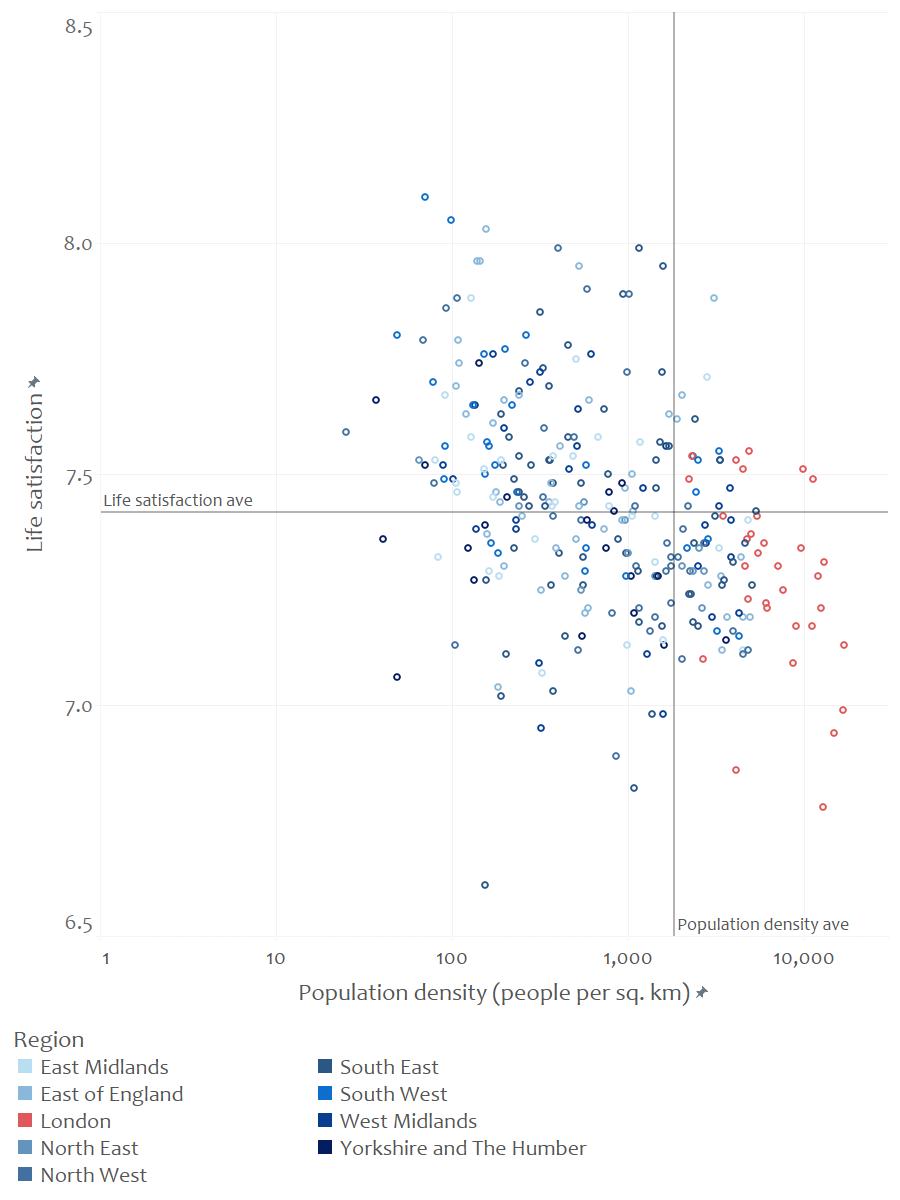
Source: Office for National Statistics (2021), Quarterly Well-being Estimates, Office for National Statistics (2021), Mid-Year Population Estimates, UK, June 2020. Life satisfaction scores are self-reported on a scale from 0 to 10. Population density is scaled using logarithms for greater clarity.
The data shows that:
- there is a slight variation in life satisfaction between and within regions, with many major cities outside of London reporting lower life satisfaction scores than the average for their region
Infrastructure systems also act as an enabler for modern life and are taken for granted. When infrastructure services work as expected – running water, well maintained roads, mobile internet – they become part of the backdrop of life and their success becomes invisible.37 This ‘invisibility’ is demonstrated in the contemporary academic literature, where research in the UK and comparable countries does not tend to focus on the efficacy of infrastructure to support quality of life.38
This is despite the fact that, historically, infrastructure transformed how and where people live and work. This raised living standards and helped to address long standing problems. Some of the most significant advances occurred in the nineteenth century, with further improvements in the twentieth century and more recent times.39
While modern infrastructure has created a new set of problems,40 these are of a different scale compared to historic issues, such as lack of clean water and basic sanitation. In many ways, infrastructure has solved a lot more problems than it has created.
For example, infrastructure contributes to health through the provision of clean water and access to health services, but air and noise pollution are damaging to health. Infrastructure can contribute to the local and natural surroundings through good urban design, access to blue and green spaces and reducing or capturing pollution and greenhouse gas emissions. But poorly designed infrastructure can lead to biodiversity loss. Similar opportunities and risks exist across all the domains.
Overall, the Commission recognises that improving quality of life involves improving and maintaining the benefits from using infrastructure, and minimising the negative impacts.
The rest of this section sets out how infrastructure impacts across the six domains outlined in the Commission’s definition of quality of life – health, local and natural surroundings, connections, affordability, comfort and convenience, and employment. Each domain sets out the positive and negative impacts, including the historic contribution of infrastructure to modern life.
Health
The World Health Organisation defines health as a state of complete physical, mental and social wellbeing and not merely the absence of disease or infirmity.41 Infrastructure has both direct and indirect impacts on physical and mental health, and these impacts can be both positive and negative.
Historically, the contribution of infrastructure to people’s health is overwhelmingly positive. It helped to transform public health, meaning people now lead longer and healthier lives.
Prior to the nineteenth century, life expectancy was low in part due to infant mortality from poor sanitation and water transmitted diseases. This was in addition to hard physical labour, work related injuries and a lack of effective healthcare.42 Numerous infrastructure improvements helped to significantly improve life expectancy, such as:
- The introduction of clean drinking water to people’s homes largely eliminated water borne diseases, thereby significantly improving public health.43
- Piped water supplies enabled increased water consumption, promoting better hygiene. Prior to this, water consumption was restricted to how much could be collected and carried into the home (a task often done by women), and on a per head basis consumption was only slightly higher than the minimum to sustain human life.44
- The change from animal to machine propulsion in transport (e.g. from horse drawn carriages to cars and trains) which reduced horse created diseases.45
- Innovations in indoor lighting replaced primitive fuels and technologies which were inefficient, unpleasant and dangerous.46 For example, candles and oil lamps were smelly and smoky with implications for indoor air quality, especially if fuel was of poorer quality.47
Modern infrastructure still has a range of impacts on mental and physical health through, for example:
- Access to health services: Communication and transport networks that are easily accessible and reliable allow access to healthcare services and hospitals.48 The emergence of ‘digital health’ has enabled patients to engage with healthcare professionals purely online. Users of digital healthcare services are also able to monitor their own health indicators, making them more equipped to detect symptoms early.49,50
- Supporting active travel: Infrastructure can encourage greater uptake in active travel, such as dedicated cycling lanes. There are studies that suggest active travel has a positive impact on physical health outcomes.51 However, there is a possibility that people who do more active travel tend to be healthier for other reasons.52 Therefore, although active travel interventions may successfully increase levels of physical activity, it is important to consider how health affects active travel levels. There is also potential for active commuting to support better mental health.53
- Air pollution: Extended exposure to air pollution can result in adverse effects on physical health, including cardiovascular disease and asthma.54 However, infrastructure changes can help to reduce these impacts. For example, electric vehicles and heat pumps do not emit nitrous oxides, which is a toxic by product of fossil fuel burning.55
- Noise pollution: Noise pollution is a risk factor for many cardiovascular diseases.56 Noise pollution from electric vehicles is significantly lower than their diesel and petrol counterparts.
- Protection against natural hazards: Floods are a risk to life, making flood defences essential for protecting communities against the physical health risks threatened by these events.57 Flooding is also highly disruptive for households and as a result can lead to significant mental health impacts.58 Flood infrastructure, therefore, is essential for minimising exposure to health related hazards. Droughts are also seen to negatively affect people’s mental health, particularly for those with lifestyles that are easily disrupted by a resilience event such as this.59 Increasing water supply capacity and reducing demand can help to alleviate some of these health effects and improve drought resilience.
- Cold stress: Households without access to proper heating are likely to experience ‘cold stress’, physical injuries and illnesses that occur when the body cannot warm itself.60 Lack of proper heating is also associated with increased feelings of helplessness and loneliness, which could be worsened given the effect of colder temperatures on physical health.61
Local and natural surroundings
The natural environment and ecosystem services have benefits for quality of life. Infrastructure has the potential to facilitate and enhance these benefits through better design. However, as all infrastructure impacts the environment in some capacity, there are negative as well as positive impacts. This relationship is discussed in more detail in the Commission’s discussion paper on natural capital and environmental net gain.62
Infrastructure can impact quality of life via local and natural surroundings through:
- Recreational benefits: Better access to green and blue spaces is associated with improved mental health and wellbeing.63 Transport is central to enhancing the connectivity to these spaces.
- Protecting natural capital assets: For example, carefully designed roads and bridges can double as wildlife crossings for species, which in turn supports local biodiversity.64
- Damage to ecosystems and biodiversity loss: Poor quality infrastructure can have detrimental effects on the natural environment. Without proper design and investment considerations, infrastructure has the potential to cause significant damage to ecosystems and contribute to biodiversity loss. In addition, infrastructure use is also a major contributor to the UK’s greenhouse gas emissions.65 However, well designed infrastructure can help to limit major environmental impacts and address climate change concerns. The Commission’s previous work indicates that the decline in natural capital over several decades is in part due to the impact of the built environment, including infrastructure.66
- Climate change adaptation: Sustainable infrastructure can also enhance the natural environment as it manages climate change risk. Combining grey and green infrastructure is one way to achieve this. Integrating green infrastructure or ‘nature-based solutions’, such as wetlands that act as flood defences,67 with grey infrastructure can help to address climate resilience.68 Sustainable drainage systems are also able to address some of these challenges by providing biodiversity value in addition to amenity value and protection against floods.69
Good design is clearly crucial to ensure that infrastructure has a positive impact on the local and natural surroundings. Design has a large influence on how consumers will interact with infrastructure services. Ensuring that quality of life outcomes are considered at the start of a project, including by engaging with local residents and incorporating their needs, is an important aspect of the design process.
Box 2: Design principles
The Commission’s design principles,70 endorsed by government in the National Infrastructure Strategy,71 identified four principles to guide the planning and delivery of major infrastructure projects: climate, people, places and value. The ‘people’ and ‘places’ principles are the most relevant to quality of life, as they both consider the importance of embedding the requirements of local communities while protecting the nearby environment through design.
The ‘people’ design principle states that design should be human scale, easy to navigate and instinctive to use, helping to improve the quality of life of everyone who comes into contact with it. This means reliable and inclusive services, as well as accessible, enjoyable and safe spaces with clean air that improve health and wellbeing.
According to the ‘places’ principle, good design should support local ecology, which is essential to protect and enhance biodiversity. Projects should make active interventions to enrich ecosystems. They should seek to deliver a net biodiversity gain, contributing to the restoration of wildlife on a large scale while protecting irreplaceable natural assets and habitats.
Well designed infrastructure can support quality of life through, for example:
- Reflecting community needs: Whether the design of an infrastructure project aligns with and reflects community needs can affect how people engage with the services. Incorporating an area’s culture and the residents’ overall sense of belonging is central to securing community support.72 Therefore, design that enhances a community’s relationship with its local surroundings should result in positive impacts to quality of life.
- Enhancing feelings of control: Infrastructure design can have a large impact on how users perceive their level of control in what happens in their local area. One example is the extent to which communities are consulted on and activity participate in developments and major works that directly affect them.73
- Complementing the natural environment: Infrastructure that works alongside natural processes can enhance the quality of life benefits that these processes deliver. Infrastructure can both contribute to, and be impacted by, the decline in natural capital and the degradation of the natural environment. However, there are schemes that have responded to this. For example, the ‘Grey to Green’ scheme in Sheffield transformed roads and tarmacked areas into green spaces and gardens.74 This helped with the area’s flooding and water pollution and improved local biodiversity.
- Providing resilience: There is now a greater focus on creating infrastructure systems that are robust enough to withstand the stresses from climate change.75 Significant action is needed to ensure economic infrastructure is climate resilient. Achieving this level of resilience should result in benefits to physical and mental health, both of which contribute to improved quality of life.
Connections
The role of digital and transport infrastructure is to connect people and businesses across the UK, providing access to key services, amenities and social networks, all of which are important to quality of life.
The last two hundred years has seen step changes in how people travel and communicate. These have enabled journeys and patterns of economic activity that would not previously have been possible. For example:
- Steam railways and streetcars led to a more than threefold increase in the maximum speed of travel compared to walking and horse drawn vehicles.76 This meant workers no longer had to live near their workplace, shaping patterns in economic activity and the built environment still seen today. Locations were able to specialise as either a workplace (city centres) or residence (suburbs), depending on their relative strengths (e.g. employment opportunities, cost of living, amenities).77
- Cars significantly improved the accessibility of travel across all income groups and had a range of indirect benefits – such as ending rural isolation and providing better access to public services and recreational opportunities.78
- Telegraphy, starting in the 1830s, saw the biggest increase in the speed of communication in human history with continents linked by undersea cables in the second half of the nineteenth century.79 More recent developments – such as widespread commercial uses of computing and the development of the internet and ecommerce80 – means digital connectivity is now almost as central to society and the economy as the supply of electricity or water.
Modern transport and digital connections can impact quality of life both positively and negatively, through:
- Access to employment opportunities and amenities: Transport connects people, businesses and communities and provides choices for where people work and live. Having access to these opportunities, in addition to amenities, is important for quality of life. Digital connectivity has also opened up opportunities to share information, search for jobs and access open education platforms.81 Many businesses depend on the quality and speed of the internet and broadband that are available to them.82
- The widespread availability of quality broadband: The availability of quality broadband has been increasing in recent years. In 2021, gigabit and superfast capable coverage increased to 65 per cent and 97 per cent of premises respectively.83 In the same year, 4G landmass coverage from at least one operator increased to 92 per cent, and areas with coverage from all operators increased to 69 per cent.84 Despite these improvements, digital coverage and reliability is not consistent across the nation, particularly for hard to reach areas, including rural areas. The importance of reliable digital connectivity was highlighted during the Covid-19 pandemic where restrictions led to the uptake of homeworking and increased social interaction virtually.85
- Supporting social networks: Transport networks allow people to meet and engage with their communities.86 Similarly, digital services have become vital for maintaining strong social connections, as people are more reliant on these services than ever. This is particularly beneficial for groups who are prone to social exclusion.87
- The increase in community severance: The construction of new transport infrastructure can cause ‘community severance’, which can reduce or even prevent communities from accessing facilities such as schools, shops and health services.88 Examples of severance from transport infrastructure include railway tracks dividing cities in half and motorways without proper pedestrian crossings. Community severance can increase distances to workplaces and key facilities. This can also contribute to feelings of social isolation and exclusion.89
Affordability
The cost of infrastructure ultimately falls to the consumer either directly through bills and fares, or indirectly through taxes. The cost of infrastructure services can determine whether individuals are able to access the benefits they provide, including, for example, employment opportunities through transport connections.90
The historic trend for infrastructure services is generally of vast decreases in costs and significant increases in consumption and service quality. Examples include:
- Energy: The cost of electricity and gas have fallen significantly since the late nineteenth century. For example, between 1890 and 2019 the price per MWh of gas fell by 65 per cent, and electricity by 96 per cent.91 However, the trends in other fuels such as petrol and coal have been much more volatile.92 Gas and electricity prices have risen sharply in recent months and the war in Ukraine is likely to push up prices further.93
- Energy services: As an example, between 1800 and 2000, the cost of lighting fell 3000 fold.94 Over the same period, household consumption increased 200 fold.95 At the same time, the quality of lighting vastly improved, with candles and oil lamps being replaced by ones powered by gas and, later, electricity.96
- Clean water: The introduction of clean running water into people’s homes represented a collapse in the costs of obtaining water (which often involved traveling great distances and queuing) and led to significant increases in consumption.97
- Broadband: Over the last decade value for money for consumers in the fixed broadband and mobile markets has increased significantly. Average household spend on telecoms has remained broadly stable in recent years, while average internet speeds and data usage have risen significantly. This coincides with the significant increase of high quality broadband over the past decade.98
- Transport: Newer, faster modes of transport allowed greater distances to be travelled in the same amount of time. Given average commuting times tend to stay constant at around an hour a day,99 this in turn has increased people’s access to cheaper land and housing away from centres of employment and leisure.100
While infrastructure services have become more affordable overall, costs are distributed differently across different population groups. Analysis of these differences can give insight into the barriers certain groups face for improving their quality of life.
In the face of current price volatility – particularly for energy services – households on lower incomes are especially burdened by the costs of infrastructure as they tend to spend a higher share of their income on these services.101 Infrastructure services are also difficult to substitute, which only adds to the difficulty in managing price volatility. This will have ramifications for accessibility and whether individuals can unlock the quality of life benefits from infrastructure.
Figure 5: Patterns of infrastructure spending vary across expenditure groups
Infrastructure spend as a proportion of total household expenditure (£ weekly household expenditure, 2020)
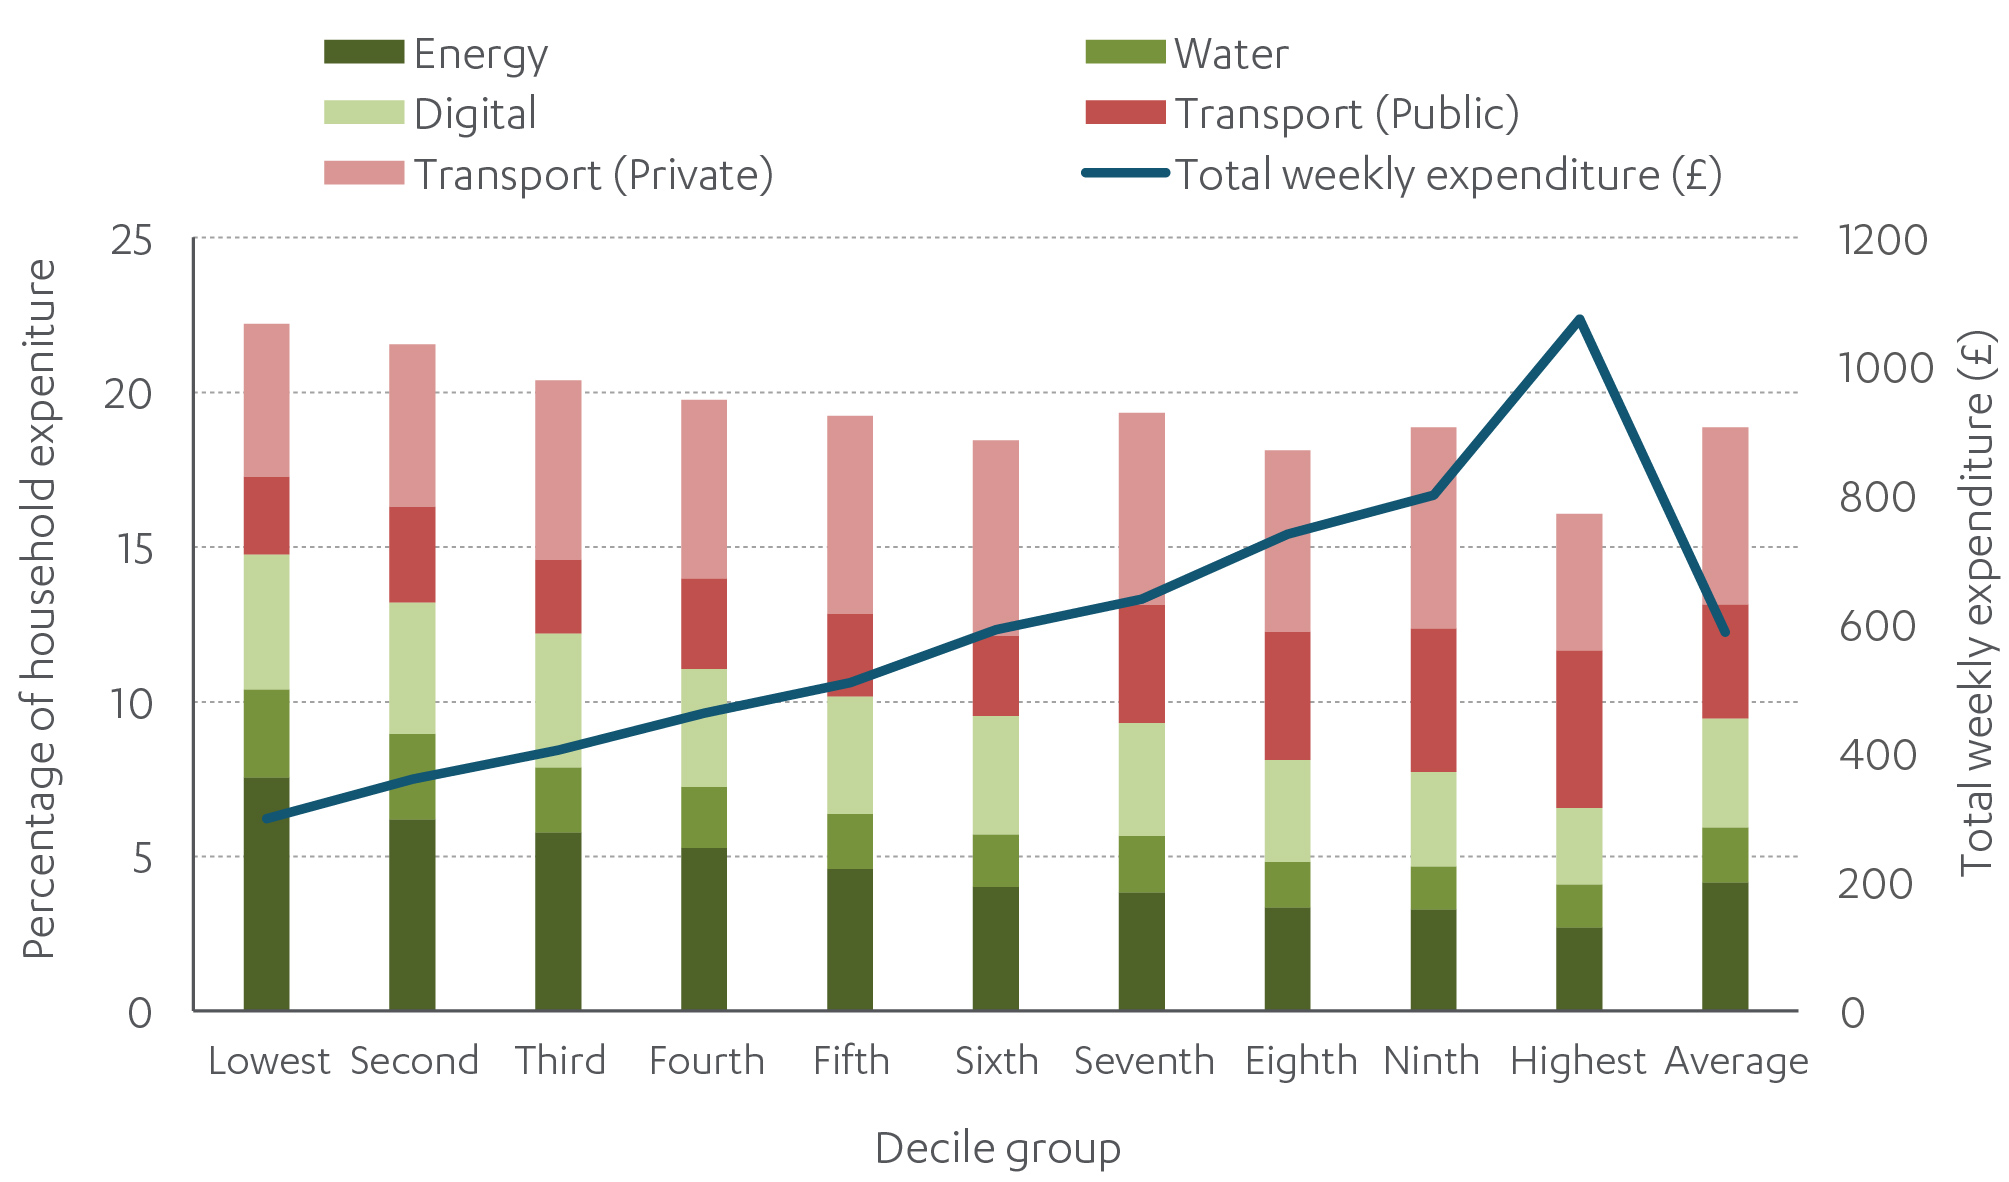
Source: ONS (2021), Family spending: detailed expenditure and trends
Figure 5 shows the percentage of weekly household expenditure spent on infrastructure services in 2020 for different decile groups. Some of the key differences are:
- Essential utilities: Energy and water make up large share of total expenditure for those on lower incomes. This is because they are essential for day to day living and therefore central to quality of life.
- Transport: Spending on transport increases for households with higher incomes. Some travel is a luxury. Wealthier households are also more likely to live in rural areas where car travel is more common.102 Similarly, household income is positively associated with commuting distance.103 Contrastingly, those on lower incomes tend to live in urban areas and travel less than those on higher incomes.
Comfort and convenience
Modern infrastructure has made many aspects of life more comfortable and convenient. Many infrastructure services are extremely convenient – turning on a tap for water, flicking a switch for light, and disposing and recycling waste.
Prior to the nineteenth century many aspects of life were dark, dangerous and involved backbreaking work.104 For example, obtaining and transporting water was an onerous everyday task, which was mostly undertaken by women on behalf of the whole household. The absence of running water as well as indoor lighting meant households tasks such as washing, cooking and cleaning were often done outside the home by rivers and streams.105 Two innovations helped shape how infrastructure is experienced today:
- Clean running water into homes was transformative. It meant women no longer had to travel great distances to collect water (often having to queue up or plan ahead in case of supply shortages) and household tasks became much simpler.106 This and other innovations supported the liberation of women.107
- Energy services (gas and electricity) enabled convenient, more reliable and better light both indoors and outdoors. The invention of the incandescent light bulb in the late nineteenth century, and individual control of lights, allowed for indoor electrical lighting of homes, offices and shops.108 Being able to flick a switch for lighting represented a step change in ease of use of lighting compared to candle and oil lamps which required a lot of manual tasks to operate and maintain.109 Improvements in lighting (at first by gas, and later electric) in streets and public spaces also helped to enhance public safety.110
In a modern context, a user’s experience with an infrastructure service can still have knock on impacts on quality of life, particularly via the health domain. Infrastructure services that are designed with users in mind can deliver additional quality of life benefits.
There are many aspects of infrastructure that can improve the experience of a user interacting with a service. For example:
- Increased broadband connection speed: A fast internet and broadband connection is central to a user’s digital experience. Download speeds have increased significantly in recent times. Between November 2019 and March 2021, the average download speed for fixed broadband increased by 20 per cent.111 Average download speeds for superfast, ultrafast and gigabit broadband increased by nine per cent during the same period.112 This comes alongside the general increase in the availability of high quality broadband over the past decade.113
- Convenience of car travel: The absence of crowding and the degree of flexibility, independence and convenience granted from car travel makes it a favourable mode of transportation for many.114
- Multimodal travel: Infrastructure design can have a significant impact on how users choose to interact with a service and therefore the overall experience of using the respective service. For example, urban design has a critical role in ensuring that journeys are possible on foot and by bicycle.115
However, there are aspects of infrastructure that can damage the experience of a user interacting with a service. For example:
- Congestion and crowding in transport: Traffic congestion for buses and private transport is associated with higher levels of stress.116 Similarly, travelling in crowded trains is stressful and uncomfortable for many commuters, and travelling regularly within these conditions may result in adverse mental health effects.117
- Commute time: Commute time is also positively associated with stress.118 Stress from commute time may have implications for the level of satisfaction commuters derive from other aspects of life. For example, there is evidence to suggest that commute time is positively associated with reduced time spent on leisure activities.119
- Slow internet connection speed: Long waiting times for video downloads and web page uploads are inconveniences that can increase stress levels.120
User experience can also be captured through customer satisfaction metrics. These measures provide an indication of how satisfied customers are with the quality and reliability of a particular service. For the company, customer satisfaction scores are an important tool for highlighting performance issues and ensuring that the customer experience is kept to a high standard. It is also a reflection of how positively a user perceives a particular service and whether using this service has improved their overall quality of life.
Across sectors, digital and water have reported the highest and most stable customer satisfaction scores. In 2020, 91 per cent of customers were satisfied with their water services.121 For digital, 79 per cent and 90 per cent of customers were at least fairly satisfied with their fixed and mobile broadband respectively.122 Satisfaction levels for energy suppliers were similarly constant over time. However, more recently, in 2021, the percentage of satisfied customers fell to 69 per cent,123 which is the largest fall in customer satisfaction since the current data began in 2018. For transport, commuter satisfaction is more variable, as provision and access differ spatially and experiences differ across modes.
Employment
Employment status is a strong predictor of life satisfaction. For example, those who are unemployed tend to have lower life satisfaction compared to the employed.124 More broadly, economic opportunity is also shaped by patterns of local productivity which vary across the UK, within and between regions.125 These in turn influence an individual’s quality of life, view of the world (including perceptions of other regions) and opportunities, which can differ profoundly between low and high productivity places.126 Lack of access to economic opportunity is also detrimental to life satisfaction.127
Infrastructure acts as an enabler for patterns of economic activity and therefore access to employment:
- Time: Interventions such as the introduction of clean running water and indoor lighting dramatically changed the nature of daily tasks, freeing up more of the day for more productive uses and leisure pursuits, and helped to facilitate the rise of modern occupations (e.g. professional and managerial occupations).128
- Working patterns: Good transport and digital connectivity allows people to balance a wide choice of jobs with a wide choice of places to live. The Covid-19 pandemic has demonstrated how good digital connectivity means a wider range of working patterns are now possible such as remote and hybrid working. This in turn opens up new options for where people live and work, for occupations where remote working is possible.129
Measuring the objective
A framework for infrastructure and quality of life
The Commission has developed a framework to measure how infrastructure can improve quality of life outcomes, see table 4. It builds directly on the domains set out in Table 2 and recognises that improving quality of life involves improving and maintaining the benefits from using infrastructure, and minimising the negative impacts.
As set out earlier in the report, resilience is one factor that affects all infrastructure sectors and will be considered under the most relevant domains, comfort and convenience and heath. This is because it relates to ‘everyday resilience’ (e.g. transport cancellations and delays) and ‘resilience to large shocks’ (e.g. impacts of natural hazards such as flood events).
While capturing the impact of the Commission’s recommendations through subjective measures of quality of life remains challenging, objective improvements in each of the domains listed are likely to translate into improved quality of life. The availability of suitable measures varies across the domains, however, the framework is built on the expectation that evidence and data will continue to improve over time.
Table 4: The Commission’s quality of life framework
| Domain | Description | |
|---|---|---|
| Health | The impacts of infrastructure services on physical and mental health | Measures exist for exposure to air, noise and water pollution, which all impact on health For air, government provides historic, latest and forecast levels of air pollution across a range of pollutants (e.g. nitrogen dioxide, PM2.5, PM10) For noise, Defra produces mapping that estimates noise from major road and rail sources, as well as the estimated number of people in England exposed to road traffic, railway and industrial noise For water and wastewater, the Environment Agency produce environmental performance assessments of water and sewerage companies, which includes pollution incidents and security of supply. They also publish water quality data based on routine sampling carried out across England |
| Local and natural surroundings | The impact of infrastructure design and operation on the local and natural environment | While numerous environmental indictors exist or are in development (e.g. biodiversity, habitat connectivity), these are normally national measures which do not separate the impact of infrastructure. Better data is required to monitor progress and benefits There is some overlap with the health domain in the measurement of exposure to pollution, which impacts the environment as well as people’s health The ONS and Natural England also produce data on access to and engagement with green space and the wider natural environment |
| Connectivity | The physical connections (transport networks) and digital connections (fixed and mobile broadband) that link people, communities and businesses | For transport, the Commission has produced a transport connectivity dataset which includes urban and interurban connectivity and congestion for built up areas in Great Britain For digital, Ofcom produce connected nations and infrastructure reports, which monitor coverage and availability of broadband and mobile services |
| Affordability | The distributional impact of the cost of infrastructure services that domestic consumers pay through bills or fares and the overall cost of infrastructure over time | The Living Cost and Food Survey provides a breakdown of household expenditure including infrastructure services across income and other population groups As part of its economic remit, the Commission is required to carry out an assessment of the impact its recommendations have on costs to businesses, consumers, public bodies and other end users of infrastructure. This includes costs to consumers and billpayers |
| Comfort and convenience | Users’ experience with infrastructure services including the level of satisfaction derived from these services | There are user satisfaction surveys carried out by economic regulators, independent watchdogs and other organisations For transport, Transport Focus run surveys different transport users by mode rail, bus, roads, transport focus, considering things like journey satisfaction and punctuality Economic regulators – Ofgem, Ofcom and Ofwat – carry out customer satisfaction surveys on energy, digital and water services respectively The Commission also produces social research on public attitudes towards economic infrastructure |
| Affordability | The distributional impact of the cost of infrastructure services that domestic consumers pay through bills or fares and the overall cost of infrastructure over time | The Living Cost and Food Survey provides a breakdown of household expenditure including infrastructure services across income and other population groups As part of its economic remit, the Commission is required to carry out an assessment of the impact its recommendations have on costs to businesses, consumers, public bodies and other end users of infrastructure. This includes costs to consumers and billpayers |
Next steps
The Commission will apply the framework in its future work including the second National Infrastructure Assessment.130 This will build on what is already captured as part of an ‘impact and costings note.’131 It will be applied proportionately, as not all recommendations will have quality of life impacts, and not all domains will always be relevant. The framework does not mandate particular measures or analytical methods for doing this, as these will vary significantly depending on the sector and specifics of the recommendation.
Next Section: Acknowledgements
The Commission is grateful to everyone who engaged with the development of this discussion paper.
Acknowledgements
The Commission is grateful to everyone who engaged with the development of this discussion paper.
The Commission would also like to acknowledge the contribution which external experts (including those on the Commission’s panels and expert advisory groups) have made to the report, and would like to thank Christopher Boyko, Kiron Chatterjee, Michael Depledge, Andrew Grant, Madeleine Kessler, and Anna Mansfield for their support.
The Commission is grateful to officials from across government and other individuals who have engaged with the development of this report.
The Commission would like to acknowledge the members of the Secretariat who worked on the report: Hannah Brown, Jen Coe, Christopher Durham, Catherine Jones, James Heath, Joanne Pearce, James Richardson, Néha Shah, Christopher Wanzala-Ryan, Zineb Ziani.
References
- National Infrastructure Commission, Our role: The Commission’s purpose, objectives and mission statement
- HM Treasury (2021), Remit letter to the National Infrastructure Commission
- National Infrastructure Commission (2020), Improving Competitiveness
- National Infrastructure Commission (2020), Growth Across Regions
- See examples: National Infrastructure Commission (2020), Anticipate, React, Recover – Resilient infrastructure systems; National Infrastructure Commission (2020), Net Zero: Commission recommendations and the net zero target, National Infrastructure Commission (2017), The impact of the environment and climate change on future infrastructure supply and demand
- For example: National Infrastructure Commission (2021) Second National Infrastructure Assessment: Baseline Report, and Buser et al (2020), The impact of infrastructure on quality of life – literature review
- ONS (2019), Measures of National Well-being Dashboard
- ONS (2019), Measures of National Well-being Dashboard
- National Infrastructure Commission (2020), Growth across regions
- National Infrastructure Commission (2018), National Infrastructure Assessment
- World Health Organisation (2012), WHOQOL: Measuring Quality of Life
- NHS Wales, Quality of Life
- Institute for Work and Health (2012), What researchers mean by Quality of Life
- Centres for Disease Control and Prevention (2018), HRQOL Concepts
- United Nations Statistics Division, Environment Statistics
- OECD (2011), How’s Life? – Measuring well-being
- ONS (2019), Measures of National Well-being Dashboard
- What Works Wellbeing, What is wellbeing?
- Centres for Disease Control and Prevention (2018), Well-Being Concepts
- OECD (2011), How’s Life? – Measuring well-being
- Department for Health (2014), Wellbeing: why it matters to health policy
- World Health Organisation (2012), WHOQOL: Measuring Quality of Life
- OECD (2011), How’s Life? – Measuring well-being
- ONS (2019), Measures of National Well-being Dashboard
- ONS (2019), Measures of National Well-being Dashboard
- ONS (2019), Measures of National Well-being Dashboard
- World Health Organisation (2012), WHOQOL: Measuring Quality of Life
- OECD (2011), How’s Life? – Measuring well-being
- Eurostat, Overview – Quality of life
- National Infrastructure Commission (2017), Economic growth and demand for infrastructure services
- Buser et al (2020), The impact of infrastructure on quality of life – literature review
- Centre for Cities (2017), Why don’t we see growth up and down the country?
- For example: Sayers et al (2020), Third UK Climate Change Risk Assessment (CCRA3): Future flood risk; HR Wallingford (2020), Updated projections of future water availability for the third UK Climate Change Risk Assessment; National Infrastructure Commission (2017), The impact of the environment and climate change on future infrastructure supply and demand; National Infrastructure Commission (2020), Anticipate, react, recover – Resilient infrastructure systems
- For example: Sayers et al (2020), Third UK Climate Change Risk Assessment (CCRA3): Future flood risk; HR Wallingford (2020), Updated projections of future water availability for the third UK Climate Change Risk Assessment
- ONS (2018), Output area classifications. Developed using ONS Census data, these demonstrate variation in people’s daily lives across different population groups. This includes differences in employment patterns and how infrastructure services are experienced (e.g. property type, use of transport across modes and purpose)
- For example: Chatterjee et al (2020) Commuting and wellbeing: a critical overview of the literature with implications for policy and future research. There is evidence that commuters trade off the drawbacks of longer and more arduous journeys against the benefits they bring in relation to overall life satisfaction (e.g. living in a suburban or rural area may be more in line with preferences)
- Buser et al (2020), The impact of infrastructure on quality of life – literature review
- Buser et al (2020), The impact of infrastructure on quality of life – literature review
- For example: Fouquet and Pearson (2006), Seven Centuries of Energy Services: The Price and Use of Light in the United Kingdom; Gordon (2012), Is U.S. Economic Growth Over? Faltering Innovation Confronts the Six Headwinds; Davidson (1986), A Woman’s Work is Never Done: A History of Housework in The British Isles 1650-1950
- Buser et al (2020), The impact of infrastructure on quality of life – literature review
- World Health Organisation (2006), Constitution of the World Health Organisation
- Gordon (2012), Is U.S. Economic Growth Over? Faltering Innovation Confronts the Six Headwinds
- For example: Gordon (2012), Is U.S. Economic Growth Over? Faltering Innovation Confronts the Six Headwinds; UK Parliament, Victorian towns, cities and slums; UK Parliament, Key dates for public health legislation; UK Parliament, The 1848 Public Health Act; Department for International Development (2013) Water, Sanitation and Hygiene
- Davidson (1986), A Woman’s Work is Never Done: A History of Housework in The British Isles 1650-1950
- Gordon (2012), Is U.S. Economic Growth Over? Faltering Innovation Confronts the Six Headwinds
- Fouquet and Pearson (2006), Seven Centuries of Energy Services: The Price and Use of Light in the United Kingdom
- Fouquet and Pearson (2006), Seven Centuries of Energy Services: The Price and Use of Light in the United Kingdom
- Mihaylova (2021), How transport offers a route to better health
- Wong et al (2022), The dawn of digital public health in Europe: Implications for public health policy and practice
- King’s Fund (2011), The impact of telehealth: a review of the evidence
- Dinu et al (2019), Active Commuting and Multiple Health Outcomes: A Systematic Review and Meta-Analysis
- Kroesen et al (2020), Does active travel make people healthier, or are healthy people more inclined to travel actively?
- Marques et al (2020), Active commuting and depression symptoms in adults: A systematic review
- For example: Royal College of Physicians (2016), Every breath we take: The lifelong impact of air pollution; Public Health England (2018), Health matters: air pollution
- European Environment Agency (2018), Electric vehicles from life cycle and circular economy perspectives
- Dzhambov and Dimitrova (2016), Exposure-response relationship between traffic noise and the risk of stroke: A systematic review with meta-analysis
- Associated Programme on Flood Management (2015), Health and Sanitation Aspects of Flood Management
- Public Health England (2020), The English National Study of Flooding and Health
- Bryan et al (2020), The health and well-being effects of drought: assessing multi-stakeholder perspectives through narratives from the UK
- Centre for Sustainable Energy (2001), Fuel Poverty and Ill Health
- Cotter et al (2012), Coping with the cold – exploring relationships between cold housing, health and social wellbeing in a sample of older people in Ireland
- National Infrastructure Commission (2021), Natural capital and environmental net gain
- For example: Public Health England (2020), Improving access to greenspace: 2020 review; Gascon et al (2017), Outdoor blue spaces, human health and well-being: A systematic review of quantitative studies
- Natural England (2015), Green bridges: A literature review
- For example: BEIS (2022), Final estimates of UK territorial greenhouse gas emissions and Institute of Civil Engineers (2021), State of the Nation 2021: Six ways for civil engineers to act on climate change
- National Infrastructure Commission (2021), Natural capital and environmental net gain
- National Infrastructure Commission (2021), Natural capital and environmental net gain
- World Bank Group, World Resources Institute (2019), Integrating Green and Gray : Creating Next Generation Infrastructure
- Zhou (2014), A Review of Sustainable Urban Drainage Systems Considering the Climate Change and Urbanization Impacts
- National Infrastructure Commission (2020), Design Principles for National Infrastructure
- HM Government (2020), National Infrastructure Strategy
- For example: Patrick Devine-Wright (2011), Place attachment and public acceptance of renewable energy A tidal energy case study; Walker et al (2017), Community benefits or community bribes An experimental analysis of strategies for managing community perceptions of bribery surrounding the siting of renewable energy projects
- Quality of Life Foundation (2021), The Quality of Life Framework
- Grey to Green Sheffield, What is Grey to Green?
- San Francisco Estuary Institute (2015), Landscape Resilience Framework
- Heblich et al, (2018), The Making of the Modern Metropolis: Evidence from London; Gordon (2012), Is U.S. Economic Growth Over? Faltering Innovation Confronts the Six Headwinds
- Heblich et al (2018), The Making of the Modern Metropolis: Evidence from London
- Gordon (2012), Is U.S. Economic Growth Over? Faltering Innovation Confronts the Six Headwinds
- Gordon (2012), Is U.S. Economic Growth Over? Faltering Innovation Confronts the Six Headwinds
- Gordon (2012), Is U.S. Economic Growth Over? Faltering Innovation Confronts the Six Headwinds
- Eardley et al (2009), Telecommunications and Community Wellbeing: a review of the literature on access and affordability for low-income and disadvantaged groups
- Townsend et al (2015), ‘Stuck Out Here’: The critical role of broadband for remote rural places
- thinkbroadband (2021), UK Superfast and Fibre coverage
- Ofcom (2021), Connected Nations 2021: UK report
- National Infrastructure Commission (2021), Behaviour change and infrastructure beyond Covid-19
- Department for Transport (2019), Transport, health and wellbeing
- The Brookings Institution (2020), Digital prosperity: How broadband can deliver health and equity to all communities
- Department for Transport (2019), Transport, health and wellbeing
- Department for Transport (2019), Transport, health and wellbeing
- Chatterjee et al (2019), Access to Transport and Life Opportunities
- National Infrastructure Commission (2020), Historic Energy Dataset – Domestic Energy Prices
- National Infrastructure Commission (2020), Historic Energy Dataset – Domestic Energy Prices
- National Infrastructure Commission (2022), Infrastructure Progress Review 2022 and Department for Business, Energy & Industrial Strategy and Ofgem (2022), Russia-Ukraine and UK energy: Factsheet
- Fouquet and Pearson (2006), Seven Centuries of Energy Services: The Price and Use of Light in the United Kingdom
- Fouquet and Pearson (2006), Seven Centuries of Energy Services: The Price and Use of Light in the United Kingdom
- Fouquet and Pearson (2006), Seven Centuries of Energy Services: The Price and Use of Light in the United Kingdom
- Davidson (1986), A Woman’s Work is Never Done: A History of Housework in The British Isles 1650-1950
- National Infrastructure Commission (2021), Baseline Report Annex A: Digital
- Marchetti (1994), Anthropological Invariants in Travel Behaviour
- National Infrastructure Commission (2019), Capturing the value of urban transport investments and Government Office for Science (2019), Future of Mobility
- Joseph Rowntree Foundation (2022), UK Poverty 2022: The essential guide to understanding poverty in the UK
- Chatterjee et al (2019), Access to Transport and Life Opportunities
- Cuberes and Roberts (2015), Household location and income: a spatial analysis for British cities
- Gordon (2012), Is U.S. Economic Growth Over? Faltering Innovation Confronts the Six Headwinds
- Davidson (1986), A Woman’s Work is Never Done: A History of Housework in The British Isles 1650-1950
- Davidson (1986), A Woman’s Work is Never Done: A History of Housework in The British Isles 1650-1950
- Gordon (2012), Is U.S. Economic Growth Over? Faltering Innovation Confronts the Six Headwinds
- Fouquet and Pearson (2006), Seven Centuries of Energy Services: The Price and Use of Light in the United Kingdom
- Fouquet and Pearson (2006), Seven Centuries of Energy Services: The Price and Use of Light in the United Kingdom
- Fouquet and Pearson (2006), Seven Centuries of Energy Services: The Price and Use of Light in the United Kingdom
- Ofcom (2021), UK Home Broadband Performance
- Ofcom (2021), UK Home Broadband Performance
- National Infrastructure Commission (2021), Baseline report Annex A: Digita
- Hisock et al (2002), Means of transport and ontological security: Do cars provide psycho-social benefits to their users?
- Active Living Research (2016), Moving Toward Active Transportation: How Policies Can Encourage Walking and Bicycling
- Haider et al (2013), Does commuting cause stress? The public health implications of traffic congestion
- Mahudin et al (2011), Modelling the spillover effects of rail passenger crowding on individual well being and organisational behaviour
- Legrain et al (2015), Am stressed, must travel: The relationship between mode choice and commuting stress
- Chatterjee et al (2019), Commuting and wellbeing: a critical overview of the literature with implications for policy and future research
- Ericsson (2016), Ericsson Mobility Report
- Consumer Council for Water (2020), Water Matters Highlights Report 2019-2020
- Ofcom (2022), Customer Satisfaction Tracker
- Ofgem (2022), Customer service data
- Aysan and Aysan (2017), The Effect of Employment Status on Life Satisfaction in Europe
- National Infrastructure Commission (2020), Growth Across Regions
- McCann (2019), Perceptions of regional inequality and the geography of discontent: insights from the UK
- Aysan and Aysan (2017), The Effect of Employment Status on Life Satisfaction in Europe
- Gordon (2012), Is U.S. Economic Growth Over? Faltering Innovation Confronts the Six Headwinds
- National Infrastructure Commission (2021), Behaviour change and infrastructure beyond covid-19. The Commission’s analysis assumed 57 per cent of the working population work in occupations where there is potential to work from home
- National Infrastructure Commission (2021), Second National Infrastructure Assessment
- For example: National Infrastructure Commission (2018), Annex: National Infrastructure Assessment impact and costings notes
Latest Updates

Coming up in 2024
This page shows a calendar reflecting the latest expected dates for Commission reports, publications and events. You can also sign up to receive our quarterly newsletter by entering your email address in the box at the foot of each website page.